Options School · Episode 7
The Greeks Explained: Delta, Gamma, Theta and Vega
 Play the video · 15:06
Four letters tell you what your option will do tomorrow, and one of them isn't even Greek. Three engines move the price of an option, and each greek measures one of them while the others stand still; delta, how much the option moves with the index, and why a cheap call can lose even when you are right about the direction; gamma, the second-order greek, how fast delta changes, and why an option close to expiry swings so much; theta, the rent the buyer pays every day, and why the bill comes at the end; vega, the weight of fear, and how an option can lose after a data release even with the index going your way; the four positions side by side, bought and sold; one number on your platform, really a curve that changes with price, time and volatility, with gamma turning into a spike near expiry, and the limits of the greeks.
For information only. Not financial advice or an investment recommendation. Trading involves risk of loss. Risk disclosure ↗︎
Chapters
In brief
- Delta tells you how much the option moves with the index, and how much exposure you have.
- Gamma, the second-order greek, tells you how fast delta changes, and it's highest near the strike and near expiry.
- Theta is the rent you pay every day, and it speeds up at the end.
- Vega is the weight of fear, and it can make you lose even when you're right.
- Whoever buys has gamma and vega on their side, and whoever sells has theta on their side.
- A greek doesn't tell you where the index will go. It tells you what happens to your position when the index moves.
- Every number in the examples comes from a model, costs aside.
The article
Read the article written from this video: The greeks explained: delta, gamma, theta and vega →
Transcript
Show the full transcript
The narration of the video, as text.
The question
Four letters tell you what your option will do tomorrow. And one of them isn't even Greek.
Welcome
Welcome to the LiveGexLevels options school. One idea at a time, from the first contracts in history to the strategies traders use today. One note: languages are dubbed automatically, so the voice may sound a bit odd. This is education, not advice. You decide, and you trade with your own broker.
Episode seven, the greeks.
They are four letters, and each one measures how the price of an option changes when just one thing changes. For each greek we'll see a surprise, the reason a position can lose even when you were right.
At the end we'll put the four basic positions side by side, calls and puts, bought and sold.
Three engines
In the second episode, the one on the long call, we saw that the price of an option depends on three engines. The first is the level of the index, the second is the time left to expiry, and the third is volatility.
A greek always answers the same question. If only one engine moves and everything else stands still, how much does the price of the option change?
Delta watches the index, theta watches time, and vega watches volatility. They are the first-order greeks, because each one measures the price of the option directly.
The fourth, gamma, is a second-order greek. It doesn't measure the price of the option, it measures how delta changes. So to understand gamma, we have to start from delta.
Delta
Delta measures how much the price of the option changes when the index moves one point.
Take our call with strike 7,800, one month from expiry. The strike is the index level from which the call starts to be worth something at expiry. This call costs 148 points and has a delta of 0.54. So if the index rises one point, the call gains about half a point.
Delta also tells you how much exposure to the index you have. With a delta of 0.54, for small moves, the call behaves like a little more than half the index.
For a put, delta is negative, because the put gains when the index falls. Our put with the same strike has a delta of minus 0.46.
Delta also gives a rough estimate of the probability of ending above the strike. A call with strike 8,000 has a delta of 0.32, and the model estimates about 30 percent.
And here is the first surprise, the cheap call. This 8,000 call costs only 67 points, and it looks like a bargain. If the index rises 100 points straight away, the call gains about 37 points, only a third of the move. If instead the index takes two weeks to climb those 100 points, the call is worth 63, less than you paid. You were right about the direction, and yet the position is losing.
The reason is that a cheap call has a low delta, so it leaves you only a small part of the move. Meanwhile time passes, and time costs money. We'll see that with theta. But first there's one more thing to know. Delta doesn't stay fixed, and gamma is what measures it.
Gamma
Gamma is the second-order greek. Its reference isn't the price of the option, it's delta. Gamma measures how much delta changes when the index moves one point.
Back to our 7,800 call, with a delta of 0.54. If the index rises 100 points, delta rises to about 0.66. If the index falls 100 points, delta drops to about 0.42. So one month from expiry, delta changes by about a tenth every 100 points, and that is gamma.
That's why, in the second episode, the numbers weren't symmetric. With the index up 100 points the call gained 60, with the index down 100 it lost only 48. On the way up delta grows, and the call gains faster and faster. On the way down delta shrinks, and the call loses more and more slowly. That's why the price curve bends, and that bend is gamma.
Gamma is highest when the index is close to the strike, and it grows as expiry gets closer.
The second surprise is that the same move can have a very different effect. Take an ordinary day, a move of about 60 points. One month from expiry, the call's delta goes from 0.54 to 0.61, so it barely changes. On the last day, instead, delta goes from 0.51 to 0.84, and the call almost triples, from 25 to 67 points.
That's why an option close to expiry swings so much, and that's exactly where selling it is riskiest. Gamma is also the risk a dealer has to hedge, as we saw in the fourth episode of the LiveGexLevels guide, the one on positive gamma. But gamma isn't free. Whoever holds it pays for it every day, and that price is called theta.
Theta
Theta measures how much value the option loses in one day, if everything else stands still. Its engine is time.
Our call loses about 2.7 points a day. It's like rent, which the buyer pays every day.
Why would anyone agree to pay it? For gamma. Thanks to gamma, whoever holds the call gains more on the way up than they lose on the way down. Of the 2.7 points a day, about 2.2 are the price of gamma, and the rest is interest.
This rent pays for itself if the index moves about 60 points a day, up or down. And 60 points is exactly the daily move the market expects, with volatility at 15 percent. If the index moves more than expected, the option buyer wins. If it moves less, the seller wins and collects the theta.
The third surprise is that the bill comes at the end. The rent isn't the same every day. Our call is worth 148 points. In the first three weeks it loses about 80 points, and in the last week alone it loses the other 68. On the last day, theta reaches almost 13 points.
That's why an option bought with little time left loses value fast, even when the index barely moves. How much movement the market expects, though, is decided by volatility.
Vega
Vega measures how much the price of the option changes when implied volatility rises one point, for example from 15 to 16 percent. Implied volatility is the move the market expects, already built into option prices. When there's fear it rises, and when calm returns it falls.
For our call, vega is about 9 points. If implied volatility rises one point, the call gains about 9 points, even with the index standing still.
Vega grows with the time left to expiry. At four months it's about double, at one week it's about half.
There's also a curiosity. Vega isn't a letter of the Greek alphabet. It's a name made up by traders, and it stuck.
And here comes the fourth surprise, the cause of many losses nobody understands. Before an expected data release fear is high, implied volatility is at 20 percent, and our call costs about 193 points. The data comes out, and the index rises 40 points. You were right. But the fear is gone, implied volatility drops to 14 percent, and the call is worth about 160 points. You lost 33 points with the right direction.
On the index chart you can't see this loss, because all you see is the index going up. You only see it in vega.
The four positions
Now let's put the four positions side by side.
The long call has positive delta, positive gamma, negative theta and positive vega. The long put has negative delta, and everything else the same as the long call.
Selling an option flips every sign. The short call has negative delta, negative gamma, positive theta and negative vega. The short put has positive delta, and everything else the same as the short call.
The rule to take home is simple. Whoever buys an option has gamma and vega on their side, and pays theta. Whoever sells has theta on their side, and gamma and vega against. Gamma and theta always have opposite signs, so you can't have both.
Let's reread last episode's short put with these signs. If the index bounces, delta, theta and vega are all on the seller's side. If the fall continues, price, volatility and gamma go against, and only time stays on the seller's side.
One number, really a curve
One last thing, and it's an important one. On your broker's platform, each greek of a position shows up as a single number. In reality that number is one point on a curve.
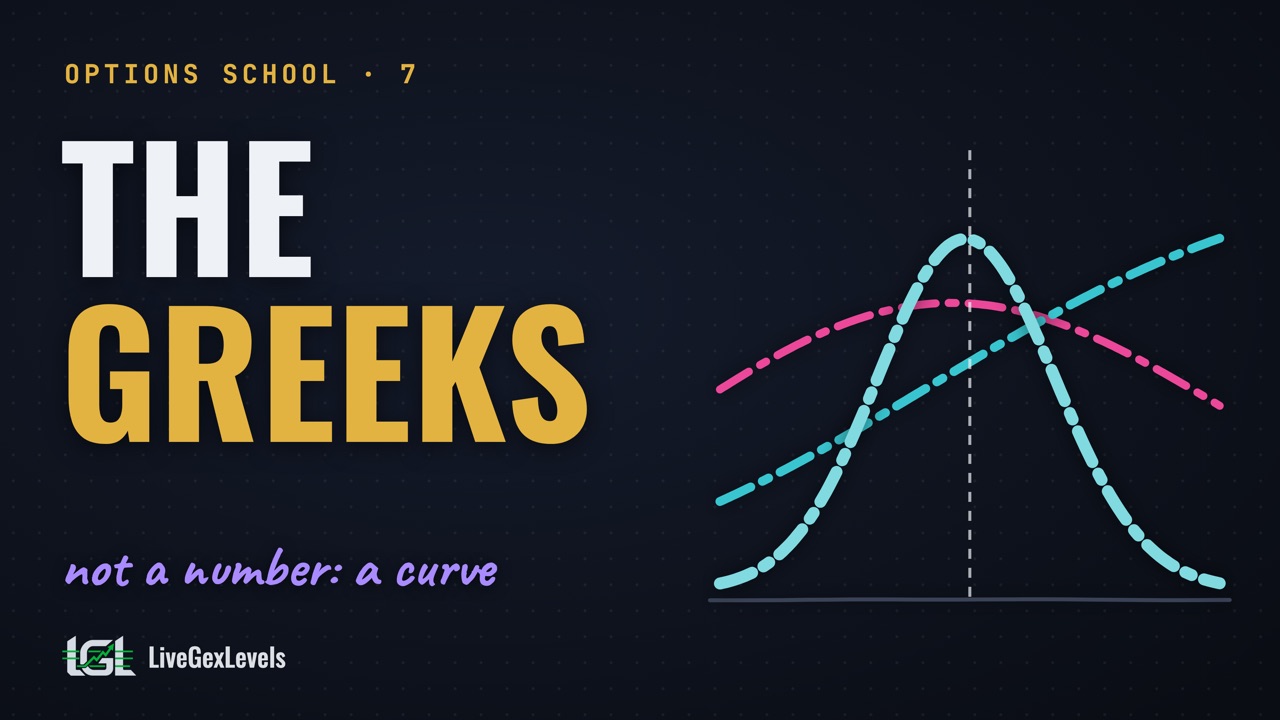
Here are the four greeks of our call, the 7,800 strike with thirty days to go, drawn the way a risk graph draws them. Along the bottom is the level of the index. Each greek is a dashed line with its own colour.
The vertical line marks the index today, at 7,800. Where it crosses each curve, we find the numbers of this episode, like a delta of 0.54 and a theta of minus 2.7.
If the index moves, you read the same curve at another point. At 7,900 the delta is already 0.66. That climb along the curve is gamma.
Volatility changes the curves too. If implied volatility doubles, from 15 to 30 per cent, the delta curve gets flatter and the gamma bell drops by half. And the daily rent of theta almost doubles.
Now let's go back to 15 per cent and take away the days, from thirty to seven, and then to just one.
Delta turns almost into a step. Below the strike it's close to zero, and above it it's close to one.
Gamma turns into a tall, narrow peak, right at the strike. On the last day it's five times higher than with a month to go. That's why, close to expiry, a small move is enough to change everything.
Theta digs a deep hole at the strike, while vega shrinks, because there's little time left for fear to count. And look at the delta just below the strike. Even with the index standing still, it slides towards zero as the days pass.
So the numbers on your platform are a snapshot of right now. Tomorrow, with another price, one day less and another volatility, the snapshot will be different.
In brief
In brief.
Delta tells you how much the option moves with the index, and how much exposure you have. Gamma, the second-order greek, tells you how fast delta changes, and it's highest near the strike and near expiry. Theta is the rent you pay every day, and it speeds up at the end. Vega is the weight of fear, and it can make you lose even when you're right.
Whoever buys has gamma and vega on their side, whoever sells has theta on their side. All the numbers in this video come from a model, costs excluded. A greek doesn't tell you where the index will go. It tells you what happens to your position when the index moves.
On the S&P 500, LiveGexLevels estimates during the session where dealer hedging builds up. These are useful levels to have in front of you when you plan where to get in and where to get out.
Up next
In the next episode we look at the greeks on a chart. On a risk graph, one curve at a time, we move the price, the time and the volatility.
We take requests, so tell us in the comments what you'd like us to explain. Before risking real money, practise with paper trading. And the guide is free with our newsletter, on livegexlevels.com.
Seeing where dealers have to hedge is information a chart alone doesn't give you. Your edge starts with preparation.
To see the levels live, sign up on the platform. There's a launch price, and you keep it for as long as you stay subscribed. And there's a free trial.