Context before the click.
Mark the areas that matter before you open a position. Call walls, put walls and the gamma flip show you where to watch for a reaction.

US500 · Intraday GEX levels
See key price levels in real time. Trading and scalping taken to the max.
Call walls, put walls and the gamma flip for the US500: on the map before you trade, updated through the session. So when price reaches a level, you already know what you’re looking at.
Your call. Your broker.
For information only. Not financial advice or an investment recommendation. Trading involves risk of loss. Risk disclosure ↗︎
US500 · synthetic scale
A reference above or near price. Watch for a rejection or a push through as price approaches: no wall is guaranteed to hold.
Prices and price path are made up to show the layout. Not a live feed, a past session or a track record.
Before the next move
A break. A rejection. A retest. With your references already on the chart, you read the move in context and weigh your next step.
Mark the areas that matter before you open a position. Call walls, put walls and the gamma flip show you where to watch for a reaction.
Levels move as the day unfolds. See when they shift and rethink your scenario while the market is still moving.
See where price sits against the nearest levels. Concrete references to size up an entry, wait for confirmation or admit the idea is off.
From levels to decisions
Trading without a map means deciding while price drags you along. Know the levels first, follow them through the session, and your alternatives are ready: where to watch for a reaction, when to act, when to sit on your hands.
The next burst, in context.
Find the area, watch the reaction, check it against your setup. A rejection or a break means more when it happens at a level you were already tracking. The entry is always your call.
The clock is running. Be ready.
Line up the strikes you’re considering against the session’s levels. Build your scenario before you commit capital, then track price as time to expiry runs out. Judge the option’s premium, spread and risk on their own.
Same-day expiry leaves little time to react. An option buyer can lose the entire premium; some short option positions can lose more than the amount initially committed.
Knowing where to look is a practical advantage. You plan your decisions before price reaches an area and adjust them as the session develops. Levels on the chart, scenarios thought through, actions judged by your own rules.
Read the risk disclosure →Access
LiveGexLevels is built around the US500 dashboard, with its own account and no portfolio to set up. Create your account, add a card and the levels are yours for the session.
€99/month
Launch price — €149/month after the launch
or €990/year — two months free
3-day free trial
Card required to start the trial. Cancel before it ends and you pay nothing. One trial per customer. Prices include VAT; the launch price stays for as long as you remain subscribed.
Free with the newsletter
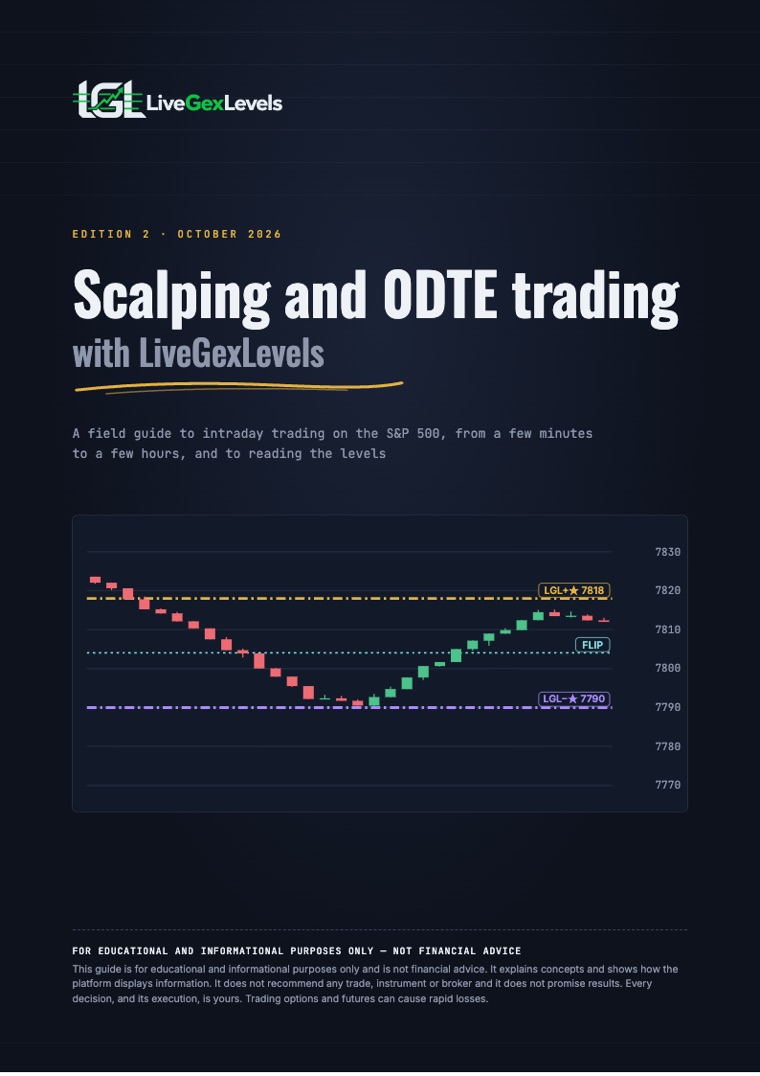
Scalping and 0DTE trading with LiveGexLevels: the market, the techniques, the problems and how to read the levels. PDF, English, Italian and Spanish.
Get the free guide →Every evening, how the day’s walls behaved — held, pierced and back, broken — on the day’s chart.
Review the levels from the session just closed and set up the next one with pre-open context.
Get a Telegram alert when something happens at the levels you follow.
Connect your own AI agent to the levels through the API and the MCP server. Included in the plan.
GEX stands for gamma exposure. On LiveGexLevels, GEX levels are the price areas the map highlights where options gamma is modelled to concentrate: call walls, put walls and the gamma flip. Treat them as areas to watch for a reaction, not as guaranteed support or resistance.
A dividing line on the map. Watch how price behaves on either side of it and as it crosses. A cross does not guarantee a reversal, and on some sessions the flip cannot be estimated at all.
No tool can promise that. The levels help you prepare your decisions: where to watch, when to act, when to wait. Results depend on your own choices and risk management. Most retail traders lose money; levels are data, not advice.
No. It shows market levels and references. You decide whether to trade, pick the instrument and manage the risk. The dashboard never places orders.
No. They are areas to watch. Price can run straight through them and the levels can change during the session. We promise no hit rate and no returns.
No. US500 is a synthetic reference index, not an official or tradable quote. Always check the instrument’s price with your broker. Any out-of-session prices are labeled as estimates.
No. You can use the LGL dashboard without linking a brokerage account. You place and manage trades with your own broker.
Yes. Create your account, start the 3-day free trial with a card, and cancel anytime from your account. After the trial the launch price is €99/month or €990/year.
36 pages on the trading day, the techniques, risk and how to read the levels. PDF, English, Italian and Spanish. Free with the newsletter.