Methodology
How the GEX map is built
LiveGexLevels estimates where option dealers are likely to hedge across the S&P 500 family and draws it as one map of gamma exposure and option-volume levels; this page explains what the levels mean, how they are combined and where the model stops.
Where the levels come from
The levels come from options positioning on the S&P 500 family: SPX and XSP index options, SPY options, and options on ES and MES futures. A proprietary model estimates how dealers are likely to hedge that positioning as price moves, and where that hedging concentrates.
The calculations are proprietary and are not published.
The dealer assumption, and its limits
Nobody outside a dealer’s desk sees its book. Like every GEX model, ours has to assume how dealers are positioned and that they hedge their gamma.
That assumption is a model, not an observed inventory. Dealer books are not public, positions change during the day, and on some sessions the assumption is wrong. Read the levels as zones where the market tends to decide, not as orders resting in the book or prices that must hold.
Two kinds of level
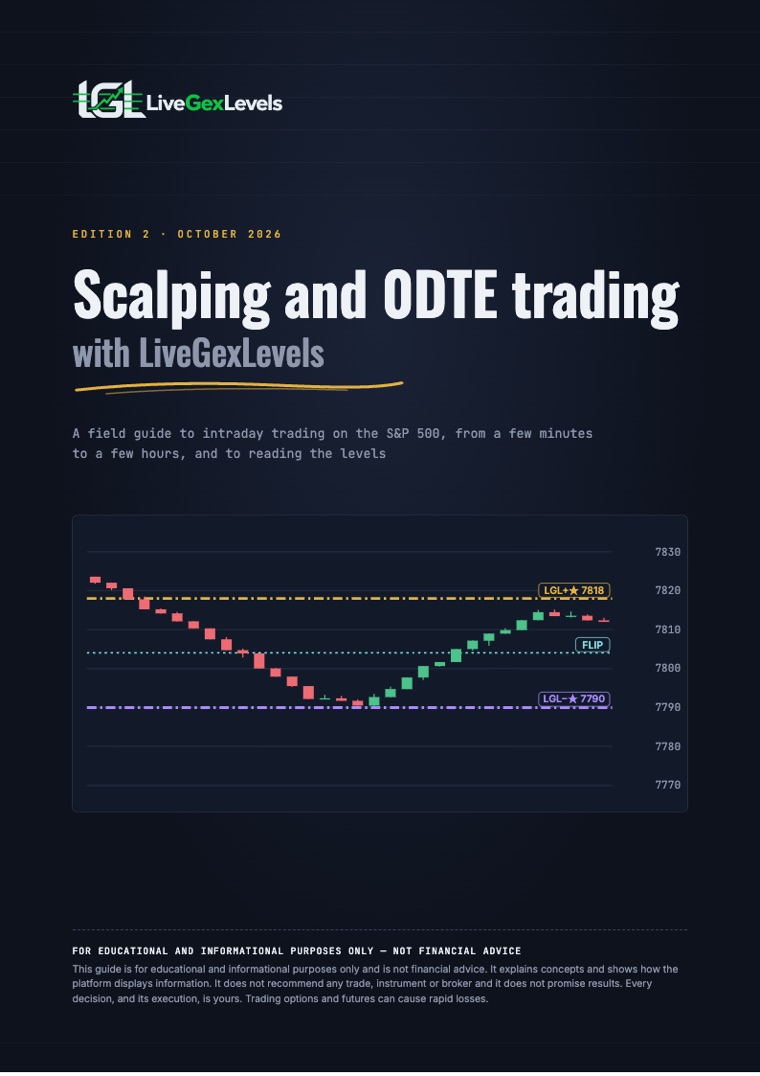
Gamma exposure (GEX) levels are prices where estimated dealer gamma concentrates: the call wall, the put wall, the gamma flip, the GEX centre of mass and lighter levels between them.
Option-volume levels are the strikes where today’s option volume concentrates across the family: the volume profile of the session. The map treats a level confirmed by both measures as the strongest kind, as a working assumption rather than a measured result.
Answers from the API and the MCP server also carry a separate block, lvl: a few key reference levels for the session, set before it opens. They are not GEX or option-volume levels, they are not part of this map and they are not a forecast. The same block carries Areas: price bands where recent daily sessions turned, graded A or B by how often and how cleanly price turned there; the grade describes the past, not how likely a band is to stop price again.
One map from three markets
Index, ETF and futures options are three independent markets. LiveGexLevels combines their option chains into one map of the S&P 500 and records, for each GEX level, how many of them agree on its price: n_markets, from 1 to 3. XSP and MES are smaller copies of the SPX and ES chains, so each counts once with its larger sibling.
LiveGexLevels weighs agreement across markets before size. After n_markets, a level is weighed by mass_pct, its share of its own family, and by mass_trend: rising, new, stable, falling or fading.
The flip and the walls come from the whole family, not from a single market.
The gamma regime and the flip
The gamma regime is the sign of estimated dealer gamma. In positive gamma, dealer hedging tends to dampen moves and ranges tend to be narrower; in negative gamma it tends to amplify them, and the market tends to travel from one level to the next. These are tendencies, not forecasts: positive gamma damps moves, it does not pin price to a strike.
The gamma flip, or zero gamma, is the price where the regime changes sign. It can move during the session, the regime can flip more than once in a day, and on some sessions the flip cannot be estimated at all.
At the open the regime also carries a premise for the day: calm; stress, when volatility is high or inverted and walls tend to hold less well than in a calm session; or panic, when nothing on the map can be relied on.
One map, several price scales
Levels are kept in SPX points and can be expressed in the other instruments of the family: in ES/MES futures points, in SPY dollars, so a level may not sit exactly on an SPY strike, and in XSP points.
LiveGexLevels carries no third-party quotes. The one price on the map is US500, a synthetic reference for the S&P 500, not an official index value or an executable price.
When it updates
During the US cash session the map is updated within seconds. Levels gain and lose mass, change role after a break, appear and vanish, and the walls and the flip move; each of these is recorded as a change event.
Outside the cash session you get the last session’s closing map, with the previous session’s high, low and close and the expected-move bands for the next one. When index options trade overnight, the walls are recomputed on thin overnight trading; when only futures trade, the levels are the evening photo. At the open the live map replaces the closing map within the first minutes.
Every answer also reports data quality. When a block is late or missing it says so, and a missing block is left empty, never invented.
What LiveGexLevels does not do
It is not a price feed: take quotes from your broker. It never sends orders and needs no broker connection. It gives no advice and does not say when to enter, where to take profit or where to stop.
Coverage is the S&P 500 family only: no single stocks, no other indices. On days with unusual flows, such as index rebalances and quarterly expirations, the map can shift faster than usual.
Questions and answers
Is the formula published?
No. The methods are proprietary. This page explains what the levels mean and how to read them, not how they are computed.
Is US500 the S&P 500 index?
No. US500 is a synthetic reference, not an official or executable quote. Always check the price of the instrument you trade with your broker.