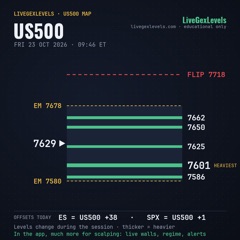
Reading the session · Episode 7
US500, Monday Nov 2, 2026: how we read the day
 Play the video · 4:51
The US500 opened about 30 points above Friday's close, right on the gamma flip. On SPX the 9:30 bar closed above all the averages, with the 5-minute EMA 8 above the EMA 21 and rising; price was above the flip and above the VWAP. Our reading: follow the direction of the averages, upward, with a precise target, the upper expected move at 7664, under the VG_GEX 7665 wall. The 7620 call expiring that day, bought at 18.0: the risk is the premium paid. Price climbed without stopping, past the 7629 resistance at 09:59 and past Friday's high at 10:12, up to 7662.20 at 10:28: two points under the expected move, under the 7665 wall, with the VG_VOL 7664 bar drawn. On the wall price stopped: on the upper expected move, with a VG_GEX wall and a VG_VOL bar overhead, the 7660 put expiring that day, bought at 13.2, no stop, held as long as SPX stayed under its 5-minute EMA 21. At 11:10 SPX closed a 5-minute bar under the EMA 21 and from 11:35 it never got back above; price went under the VWAP at 11:21 and under the flip at 12:26; at 12:46 a pierce of the 7595 wall and a return, then down again; at 14:20 price left the day's expected move, under 7585, down to 7539.29 at 15:58 and a close at 7542.83.
A reading of a past session, not a signal and not a trade suggestion. Walls are model estimates. Points are hypothetical; past results do not guarantee future ones. Risk disclosure ↗︎
Chapters
Transcript
Show the full transcript
The narration of the video, as text.
Monday in one look
US500, Monday, November 2. Our reading: plus one hundred and twenty-seven points of premium. Let's see how we read the day, and why.
One note: languages are dubbed automatically, so the voice may sound a bit odd.
The day
On Monday the US500 opens at 7619, some thirty points above Friday's close, right on the flip. In the morning it climbs to 7662, at 10:28, two points from the upper expected move. Then it falls for the rest of the day, and the VIX goes up: low 7539 at 3:58, close at 7543. One hundred and twenty-three points from the high.
The open: following the averages
At the open we look at SPX: the 9:30 bar closes above all the averages, and the EMA 8 sits above the EMA 21, rising. Price is above the flip and above the VWAP. The reading: we follow the direction of the averages, upward, with a precise target: the upper expected move, at 7664. Above it, the VG_GEX 7665 wall. We buy a call on SPX, strike 7620, expiring today, at 18 points: the risk is the premium paid.
Up to the expected move
Price climbs without stopping: at 9:59 it passes the 7629 resistance, at 10:12 Friday's high, and at 10:28 it touches 7662! Two points under the expected move, under the 7665 wall, and right there the VG_VOL 7664 bar shows up too. We sell the call at 44: plus twenty-five and a half points of premium.
Our reading on the wall
On the wall, price stops. We are on the upper expected move, with a VG_GEX wall and a VG_VOL bar overhead: we buy a put on SPX, strike 7660, expiring today, at 13.2 points. The risk is the premium paid, with no stop. And we hold it as long as SPX stays under its five-minute EMA 21.
The fall, to the close
Price falls. At 11:10 SPX closes under the EMA 21, and from 11:35 it never gets back above. At 11:21 the index is under the VWAP, at 12:26 under the flip: below it, gamma is negative, and dealers tend to chase the price. At 12:46 a pierce of the 7595 wall, and a return; then price heads down again. At 2:20 it leaves the day's expected move, under 7585. It falls to 7539, and closes at 7543. SPX never closed a bar above the EMA 21: we're out at the close, and the put is worth 115.4. Plus one hundred and two points of premium, after costs.
The tally
The tally for Monday: the call from the open to the expected move, plus twenty-five and a half; the put from the 7665 wall, plus one hundred and two. In total, plus one hundred and twenty-seven points of premium.
How we read it
It's a reading, not a signal. If it helps you, subscribe and share the video. LiveGexLevels gives you the tools to read the context and decide your trades. When several signals line up, that's where we find our edge. To see the levels live, sign up on the platform. There's a launch price, and you keep it for as long as you stay subscribed. And there's a free trial.