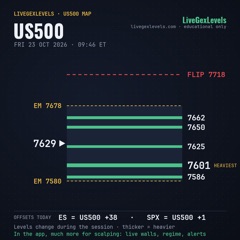
Reading the session · Episode 1
US500, Friday Oct 23, 2026: how we read the day
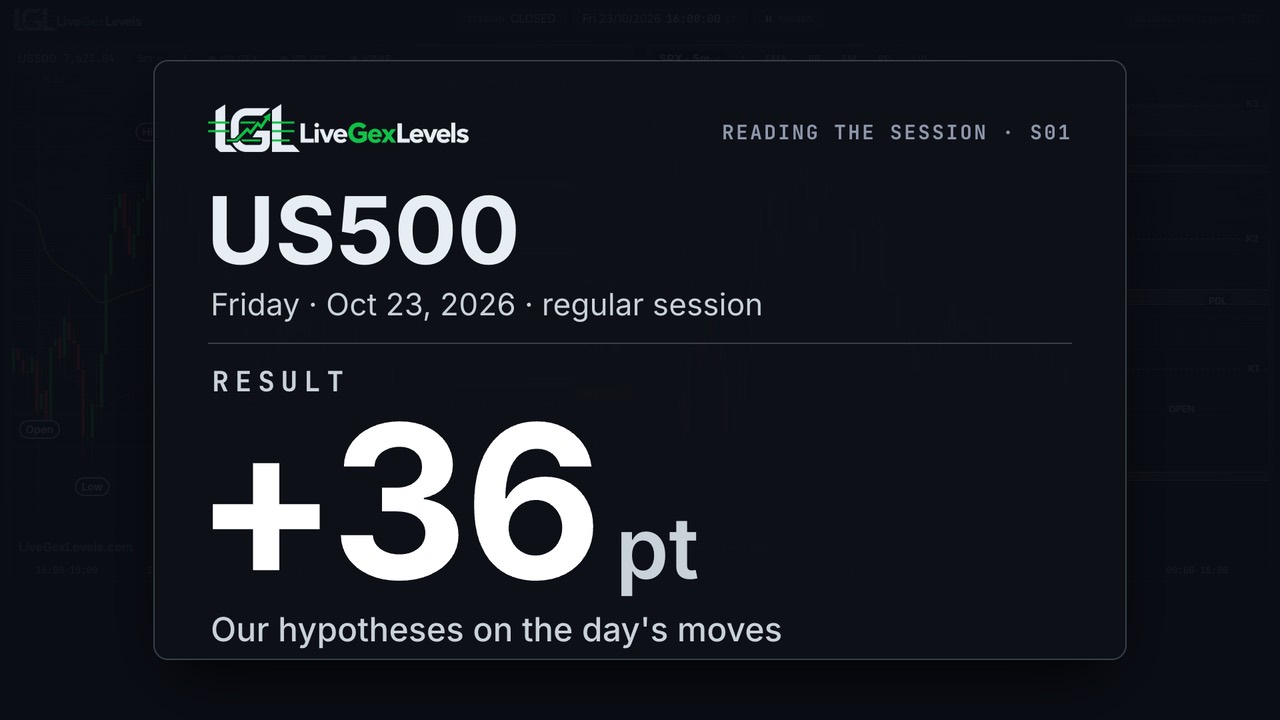 Play the video · 5:42
US500, Friday October 23, 2026, replayed the way we read it on the LiveGexLevels US500 page. On the left, the US500 with the VG_GEX walls and their share of the gamma mass, the VG_VOL options volume by strike and the VWAP with its bands. On the right, the SPX 5-minute geometry, shown without prices: session open, EMAs, Bollinger bands and expected move. We also show our LVL levels, prepared the evening before, and the Areas: the tier-A bands where price has already reacted several times. Moment by moment: where price reacted, where it stopped, and when the geometry turned.
In the replay each hypothesis appears when its rule arms, before the move: where we get in, where we stop, where we get out. They are our hypotheses on the day's moves: our way of reading the market. The full reading method has its own series; here, the day in brief. Soon we'll do it live, during the session.
A reading of a past session, not a signal and not a trade suggestion. Walls are model estimates. Points are hypothetical; past results do not guarantee future ones. Risk disclosure ↗︎
Chapters
Transcript
Show the full transcript
The narration of the video, as text.
Friday in one look
US500, Friday, October 23. Our reading of the day: plus thirty-six points. On Friday the US500 went up and down all session and closed almost right where it opened. Let's see the hypotheses of the day, and why.
One note on languages: we want these videos to be free and watchable in many languages, so the translations, the dubbing and the subtitles are made automatically. In some languages the voice may sound a bit odd.
The picture at the open
Before the open the picture leans to the downside: it opens below yesterday's low, below the VWAP and its lower band. It's not a forecast: it tells us where to watch for reactions. And at the start we wait: after the first few minutes we look at the VG_GEX levels and how they have settled. If there's a wall close to price, the first touch, from above or from below, is the first place to look for a bounce. On Friday, once the map has settled, price touches the nearest wall from above, and bounces: plus thirteen points in five minutes.
The first drop
On the second touch, the wall below gives way, and price drops. It goes through the lower VWAP band and doesn't stop there. Now price is far from the VWAP, under the lower band, and it touches a tier-A Area. Why a rise? Price is stretched far from the VWAP and lands on an A Area. Right around it, the option volume, VG_VOL, is among the highest, almost all puts. And on SPX, price is below all the moving averages: a bounce is likely. But there's no VG_GEX wall close by: with one, we'd go in with more conviction. Here we follow it, but with half the capital. Hypothesis A, the bounce: we get in if the five-minute candle closes above the Area, with the stop just below it. Why there? The close above tells us the Area held. Half we close at the VWAP, the other half we let run to the opposite band. The candle closes above: we're in. And look at this, beautiful: Area hit perfectly, just as we had hypothesized! From there it takes off, fast.
The turn
Within minutes price takes back the open and the VWAP. At the VWAP we close the first half. And the second half reaches the opposite band: hypothesis A closed, plus twelve points, with half the capital.
On the wall
Price stays around the wall for almost an hour and a half. Now it's above the upper band and touches an Area from below, right where there's a tall VG_VOL bar, almost all calls, and with a VG_GEX wall of medium mass a little above. That's hypothesis A the other way round, a drop, with the stop just above. But on SPX the moving averages still point up, and the drop doesn't start right away. Price goes past the stop by a whisker, minus five points. It happens: you respect the stop. The high comes just under the next level, another Area with a wall. Hypothesis B: why a drop? Price bounces between two VG_GEX walls: every dip under the lower one is bought back, and the upper one stops it just under. And on SPX the candle drops back onto the fast average. We think it will drop, but we don't know when: so a downside spread to the close, with the stop above the second level.
The afternoon
Then watch the wall below, the one price lived on for an hour and a half. Within half an hour it loses mass, and when price comes back to it, it's gone. The static open-interest map alone couldn't tell whether this wall would hold. The session's data showed it, as it gave way. From there, the drop comes. In the afternoon the first LVL level holds price, touch after touch: seven times. Beautiful to see it work like that! And a rise into the close? It would take a heavy put wall just under price: there isn't one, so no hypothesis. In the last ten minutes the level gives way, and hypothesis B reaches the close: plus twenty-nine points.
The tally
Friday's tally. Hypothesis A, the bounce from the Area, with half the capital: plus twelve. A the other way round: stopped, minus five. Hypothesis B, the spread to the close: plus twenty-nine. The rise into the close: no conditions, no hypothesis. In total, plus thirty-six index points. It's our way of reading the market. Soon we'll start doing it live, during the session.
How we read it
It's a reading, not a signal. If this way of reading the market helps you, help us grow the channel: subscribe and share it with friends who follow the markets. You'll also find the free guide in the description.