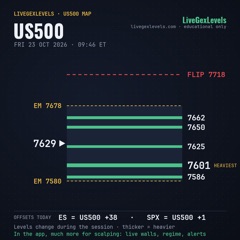
Shorts
US500, Monday Nov 2: Two Points From the Line
 Play the video · 1:01
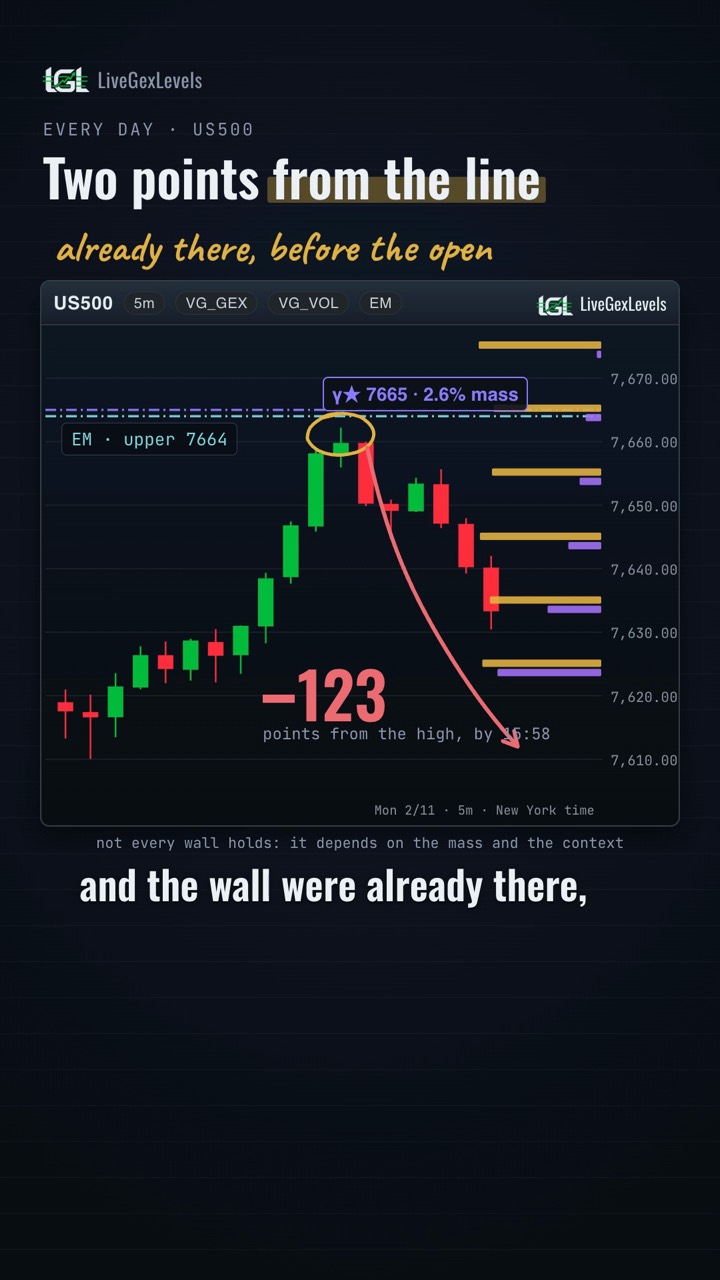
Monday, November 2nd. Before the open there was a line on our chart, the upper expected move at 7,664, and right above it the 7,665 wall. The price opened at 7,619 and climbed without stopping; at 10:28 New York time it reached 7,662, two points under the line, with the VG_VOL 7,664 bar drawn too. There it stopped, then it fell for the rest of the day: 123 points lower by the last minutes.
On LiveGexLevels you see the expected move and these walls on the index during the session, with their weight.
For information only. Not financial advice or an investment recommendation. Trading involves risk of loss. Risk disclosure ↗︎
Transcript
Show the full transcript
The narration of the video, as text.
Monday, November 2nd. Before the open, there was a line on our chart: the upper expected move, 7,664. And right above it, the 7,665 wall.
The price opens at 7,619 and climbs without stopping. At ten twenty-eight, New York time, it reaches 7,662.
Two points under the line. And right there, the VG_VOL bar at 7,664 shows up too. The price stops.
From there, down for the rest of the day: 123 points lower by the last minutes.
The line and the wall were already there, before the open. On LiveGexLevels you see them on the index during the session, with their weight.
The levels during the session: livegexlevels.com.