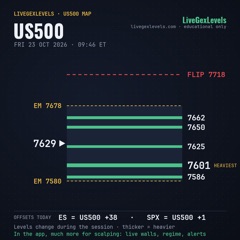
Reading the session · Episode 3
US500, Tuesday Oct 27, 2026: how we read the day
 Play the video · 3:07
On Tuesday the US500 opens just under Monday's high, goes over it for a quarter of an hour and comes back under. At 10:21 it falls to Monday's close, and from there it climbs, up to the high at 3:45. The first trade is a quick scalp, on Monday's close.
A reading of a past session, not a signal and not a trade suggestion. Walls are model estimates. Points are hypothetical; past results do not guarantee future ones. Risk disclosure ↗︎
Chapters
Transcript
Show the full transcript
The narration of the video, as text.
Tuesday in one look
US500, Tuesday, October 27. Our reading: plus twenty-one points. Let's see how we read the day, and why.
One note: languages are dubbed automatically, so the voice may sound a bit odd.
The day
On Tuesday the US500 opens just under Monday's high, goes over it for a quarter of an hour and comes back under. At 10:21 it falls to Monday's close, and from there it climbs, up to the high at 3:45.
The scalp at Monday's close
The first trade is a quick scalp, on Monday's close. Price falls from the open and comes down onto Monday's close from above, at 10:21. Right under it there's a tall VG_VOL bar, almost all puts, and a little lower an LVL level. No VG_GEX wall close by: the nearest is almost thirty points below. On SPX price is below the fast averages, but inside the Bollinger bands, from the five-minute chart to the daily. Long at the candle's close, with the stop three points under Monday's close. And look: the low stops two tenths of a point from the level, and price takes off! A minute later we take half off: plus four points. The other half we let run, with the stop at breakeven. Price never comes back to the entry, and climbs to the close: the scalp makes plus twenty-four points, after costs.
The short at Monday's high
The second trade comes earlier, at the open: Monday's high. Price opens just under it, goes over it at 9:31, and the first five-minute candle closes back under. Just under the level there's a tall VG_VOL bar, mostly calls. No VG_GEX wall close by: the map is empty around price. On SPX the candle closes above the upper Bollinger band, on the five- and the fifteen-minute chart: price is far from its averages. Short on the re-entry, with the stop just over the test's high. Two minutes later price climbs back and takes the stop: minus three points, after costs. It happens: we respect the stop.
The tally
The tally for Tuesday: the scalp, plus twenty-four; the short at Monday's high, minus three. In total, plus twenty-one index points.
How we read it
It's a reading, not a signal. If it helps you, subscribe and share the video. The free guide is in the description.