LiveGexLevels Guide
The Wall Was on the Chart at 9:25 (GEX Levels, S&P 500)
 Play the video · 3:34
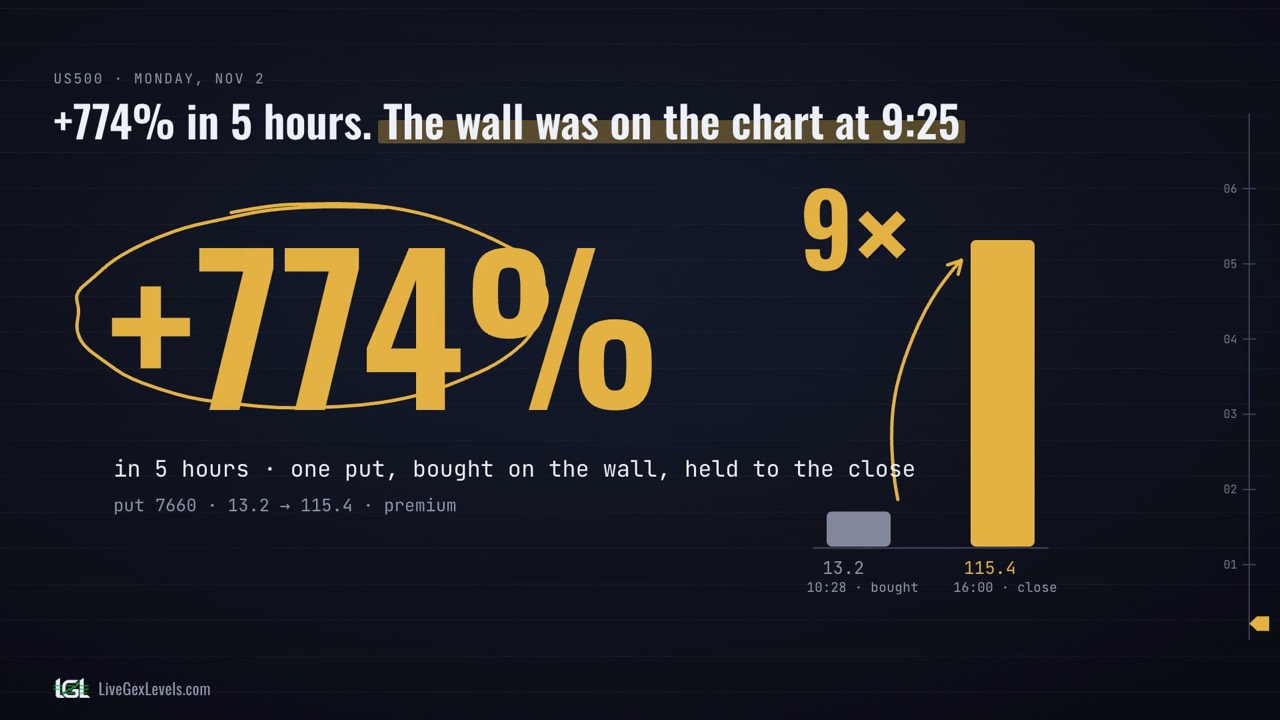
That wall, and the line of the expected move, were on the LiveGexLevels US500 chart at 9:25, before the open; the market reached them at 10:28, stopped 2 points under the line and fell 123 points. Why dealer hedging creates walls, where the flip is, and how to read walls, expected move and VWAP. It doesn't happen every day: it happens when the level was there first.
For information only. Not financial advice or an investment recommendation. Trading involves risk of loss. Risk disclosure ↗︎
Chapters
Transcript
Show the full transcript
The narration of the video, as text.
The question
Plus seven hundred seventy-four percent in five hours. One put, bought on the wall, held to the end of the day. And that wall was on our chart at 9:25, before the open. At 10:28 the market reached it. And it stopped 2 points away, and from there it fell 123 points. It's not magic. It's options. And in three minutes you'll know where to look tomorrow morning.
One note: languages are dubbed automatically, so the voice may sound a bit odd.
Every morning, every evening
Here, every morning before the open, you get the walls where the dealers' hedging piles up, with their weight. Every evening you see what the market did on those walls, numbers in hand. If you trade the S&P 500, subscribe now. Tomorrow morning you're on the level before the price.
Why the price stops there
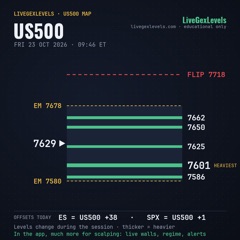
Why does the price stop right there? Whoever buys or sells an option faces a market maker. He doesn't bet. He hedges by buying and selling the future. Where options pile up, the hedging becomes a wall that brakes the price. We measure those walls every minute, and put them on the chart with their weight. A line splits the chart in two, the flip. Above it, dealers brake the market. Below it, they chase it.
On the US500 page
Here's how it looks. The dashed lines are the walls, with their mass next to them. The band is the day's expected move. On Monday the price climbs straight to the upper edge, under the 7665 wall, and there the volume bar shows up too. Two points under the line, the high of the day. Friday, on the other side. The 7600 wall, the heaviest near the price, first test at 10:23, a 28-point bounce to the next wall. The line was there first. The price came after.
Not every wall holds
Not every wall holds. It depends on mass and context. A light wall tends to give way, a heavy one tends to hold. On Monday, the price pierced the 7595 wall, the lightest in that area, by two points, and came right back.
Our Monday reading
Our reading of Monday. A call up to the upper edge, a put from the wall to the end of the day. Plus 127 points. The put alone, from 13 to 115, nine times the price paid. It happens when a heavy wall gets confirmed and grows in weight during the session.
Tomorrow's levels
Want tomorrow's levels before the open? The link is below. A launch price you keep for as long as you stay subscribed, and a free trial. Subscribe to the channel. Every evening there's the reading of the session. Be at the level before the price gets there.