LiveGexLevels Guide · Episode 6
Gamma Flip Explained: Why the Market Brakes Above It and Speeds Up Below
 Play the video · 7:35
Large funds buy puts below the price to protect their stocks, and many pay for them by selling calls above it. Market makers hold the other side: short puts below (negative gamma, the accelerator from Guide #5) and long calls above (positive gamma, the brake from Guide #4). Add it all up for every level the index could reach, and somewhere the total crosses zero: that is the gamma flip. It is an estimate, because nobody sees the market makers' books. Above it, their hedging tends to brake the moves; below it, to push them. The flip moves every day, and it isn't a switch: in our tests, crossing it during the session didn't give a trade, either following the cross or going against it. What it tells you is how big the day can be, not which way. Drawings, not market quotes. Education, not advice: trading can lose money.
For information only. Not financial advice or an investment recommendation. Trading involves risk of loss. Risk disclosure ↗︎
Chapters
In brief
- Large portfolios buy puts below the price, and many sell calls above it.
- The market makers hold the other side: negative gamma below, positive gamma above.
- Where the total changes sign is the gamma flip, an estimate: above it, the hedging tends to brake; below it, to push.
- It moves every day, it isn't a switch, and it tells you how big, not which way.
The article
Read the article written from this video: The gamma flip: why does gamma change sign? →
Transcript
Show the full transcript
The narration of the video, as text.
The question
The gamma flip: why does gamma change sign? Above a certain line, the market tends to brake. Below it, it tends to speed up. Where is that line? Why is positive gamma usually above the price, and negative gamma below it? And does it change the way you trade?
Welcome
Welcome to the LiveGexLevels guide series: one idea at a time, to read the S&P 500 through options. One note: languages are dubbed automatically, so the voice may sound a bit odd. This is education, not advice: you decide, and you trade with your own broker.
Today: how large portfolios protect themselves, and what that leaves in the market makers' hands. Then the line where gamma changes sign: the gamma flip. And finally what the studies say, ours included, about each side of it.
How portfolios protect themselves
Think of a large fund that owns stocks. What it fears is a crash. So it buys puts below the price: insurance, as we saw with the long put in the options school. Puts cost money, so many funds pay for them by selling calls above the price: they give up part of the upside, in exchange for the protection. A floor below, a cap above: it's called a collar. Studies of index options find that end users, on balance, are buyers of options, above all puts below the price. Calls sold above are common too, but less consistently.
The other side
Now look at the other side of those trades. The market maker sold the puts below the price: short options, negative gamma, the accelerator from the last episode. And he bought the calls above the price: long options, positive gamma, the brake from the episode before. So, on average, the market makers' gamma is negative below the price, and positive above it.
The gamma flip
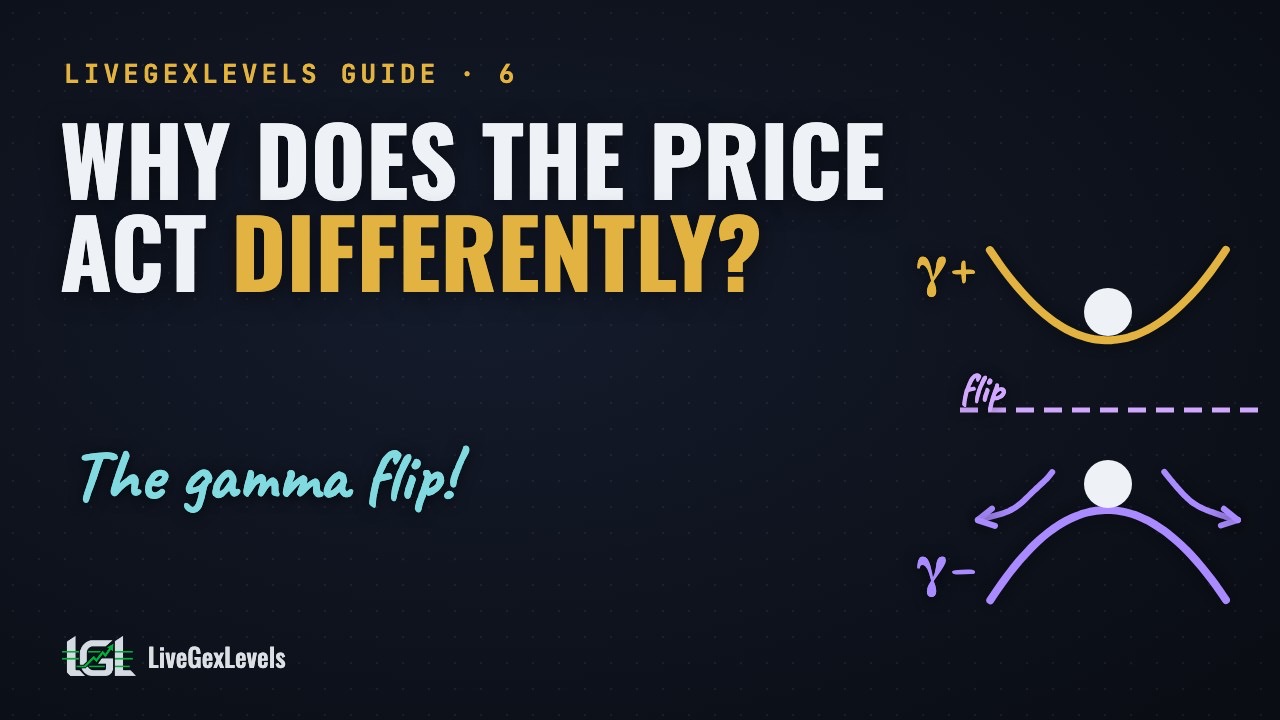
Now let's add it all up, for every level the index could reach. Far below, the short puts dominate: the total gamma is negative. Far above, the long calls dominate: the total is positive. Somewhere in between, the total crosses zero. That level is the gamma flip. Above it, the market makers' hedging tends to brake the moves. Below it, it tends to push them. And remember: it's an estimate. Nobody sees the market makers' books: that's what GEX estimates.
The valley and the hilltop
Here's a way to picture it. Above the flip, the price is like a ball in a valley: push it, and it tends to roll back. Below the flip, it's like a ball on a hilltop: push it, and it tends to keep rolling, either way. Same market, same day, two different behaviours, depending on which side of the line the price is.
What's special about the flip
What's special about the flip? Three things. First, it moves. Every day new positions open, others expire, and the price itself moves: the flip moves with them. Second, it isn't a switch. We tested it: crossing the flip during the session didn't give us a trade, neither following the cross nor going against it. Third, what really changes is the size. In our studies, negative gamma came with bigger days, but it didn't tell us the direction. Bigger days, not a direction.
Does it change how you trade?
So, does it change the way you trade? Many traders say: sell volatility above the flip, buy it below. Here's what the studies say. SqueezeMetrics, who made the GEX idea popular, found that when gamma is high, the next days tend to move less. Barbon and Buraschi found that negative gamma goes with intraday momentum, and positive gamma with reversals. Baltussen and colleagues found that on short-gamma days the last half hour tends to follow the rest of the day, then partly reverses in the days after. And on zero-day options, Dim, Eraker and Vilkov found that the market makers' gamma is small, and doesn't spread volatility. Our studies agree on the size, not on the direction: the regime tells you how big, not which way. And selling volatility only in positive gamma looked good on past data, but it wasn't confirmed on new data: so it's not a rule.
What does that leave you, in practice? Below the flip, prepare for bigger days: wider stops, smaller size, and don't take it for granted that a wall will hold. In stressed markets, in our studies, walls did no better than chance. Above the flip, in theory, positive gamma dampens moves, so walls should hold more often there: the first numbers point that way, but we haven't confirmed it. The flip is a map of how big the day can be, not a signal.
On the LiveGexLevels page
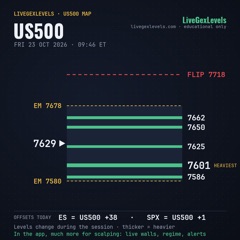
On the LiveGexLevels page, the flip is a line on the chart, next to the walls, and the regime, positive or negative gamma, is shown next to the price. Before the open, one look at which side of the flip the price is on tells you how big a day to prepare for.
In brief
In brief. Large portfolios buy puts below the price, and many sell calls above it. The market makers hold the other side: negative gamma below, positive gamma above. Where the total changes sign is the gamma flip. Above it, the hedging tends to brake; below it, to push. It moves every day, it isn't a switch, and it tells you how big, not which way.
Up next
Coming up in the guide: how far can the price go today? The expected move, and the volatility regime. Tell us in the comments: do you trade differently above and below the flip? Before risking real money, practise with paper trading. The guide is free with our newsletter. You'll find it on livegexlevels.com. Knowing which side of the flip the price is on is information a chart alone doesn't give you. Your edge starts with preparation. To see the levels live, sign up on the platform. There's a launch price, and you keep it for as long as you stay subscribed. And there's a free trial.