LiveGexLevels Guide · Episode 3
Only /ES and VWAP? The GEX Levels You're Missing on SPX, SPY & ES
 Play the video · 8:40
The S&P 500 trades through five main instruments: the SPX index, XSP (a tenth of SPX), the SPY fund, and the /ES and /MES futures. Arbitrage, SPY creations and market makers hedging with futures keep them moving together, each at its own price. There are two different volumes: the underlying's (futures and SPY shares; SPX and XSP are indexes and have none of their own) and the options' (in dollars, about three quarters on SPX among the three biggest). LiveGexLevels reads them in two places: the underlying's volume with the price, the options' volume strike by strike on the right edge of the US500 chart, on two linked charts. Reading them together always adds context to your reading. Education, not advice: trading can lose money.
For information only. Not financial advice or an investment recommendation. Trading involves risk of loss. Risk disclosure ↗︎
Chapters
In brief
- One index, five instruments, moving together, each at its own price.
- Two volumes: the underlying's, where the futures and SPY trade and the indexes have none, and the options', about three quarters on SPX.
- LiveGexLevels shows the first with the price and the second on the right edge, on two linked charts.
- Read together, they always add context to your reading.
The article
Transcript
Show the full transcript
The narration of the video, as text.
The question
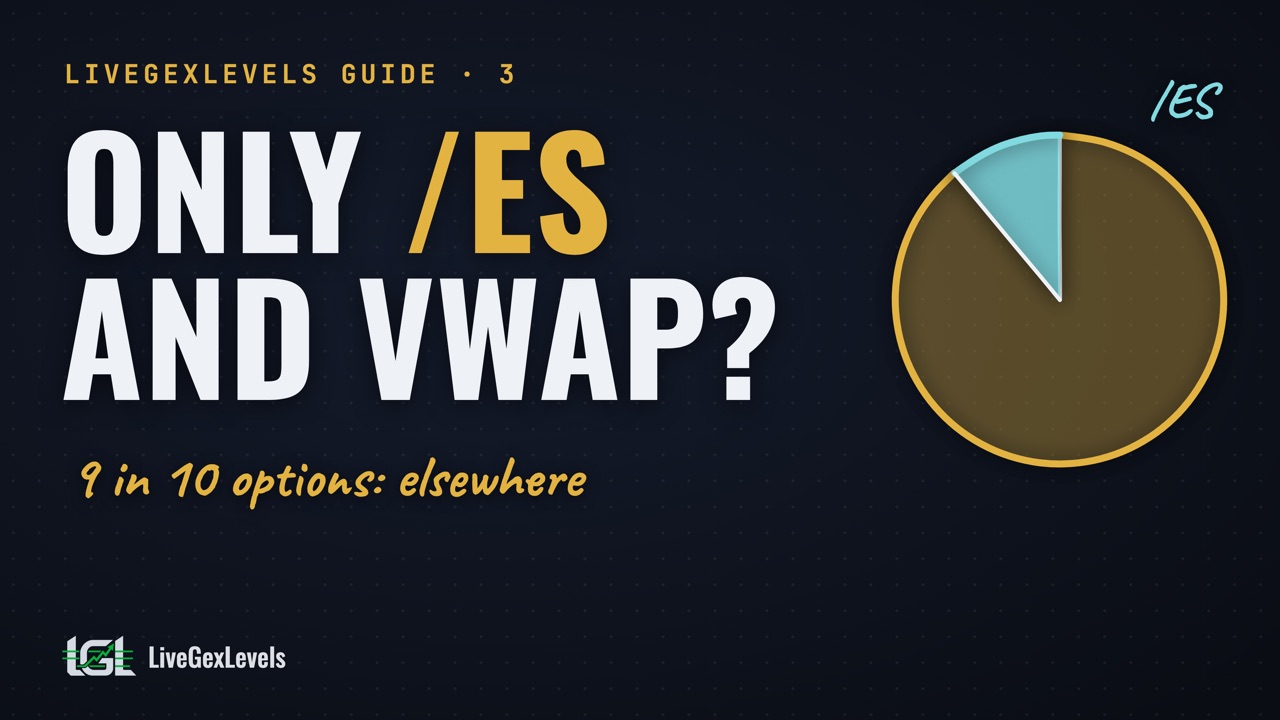
Are you scalping with only ES and VWAP? Then you're missing a big slice of the action. The S&P 500 trades through five main instruments, and, measured in dollars, almost nine in ten of its options trade away from ES. Where is the rest, and how do you read it all together?
Welcome
Welcome to the LiveGexLevels guide series: one idea at a time, to read the S&P 500 through options. One note: languages are dubbed automatically, so the voice may sound a bit odd. This is education, not advice: you decide, and you trade with your own broker.
Today: one index and five instruments, and what ties them together. Then two different volumes, the underlying's and the options', with real numbers. And how LiveGexLevels lets you read them together, in two places.
One index, five instruments
Start with the family. SPX is the S&P 500 index itself: a number calculated from about five hundred companies. You can't buy it, but you can trade options on it. XSP is the same index divided by ten, with its own options. SPY is a fund that holds those stocks: it's worth about a tenth of the index, but not exactly, because of dividends and costs. Then the futures: ES is worth fifty dollars a point, and MES, the micro, a tenth of that.
Why do they move together? Arbitrage. If the future drifts away from its fair value, traders buy one side and sell the other, and the gap closes. SPY is kept on its value by the big firms that create and redeem its shares. And the market makers who take the other side of SPX options often hedge them with futures. So a move in one quickly shows up in the others, each at its own price. Research says futures and SPY share the lead, and when volatility rises, futures tend to move first.
Two different volumes
Now the key point: there are two different volumes. The underlying's volume counts futures contracts and SPY shares changing hands: how much of the instrument itself is being traded. The options' volume counts option contracts: where people buy and sell protection and bets, strike by strike, and that's where the positions behind the walls come from. Two different things, to be read in two different places.
The underlying first, in dollars a day. ES trades about one and a half million contracts: more than half a trillion dollars. SPY trades more than forty billion, MES a little less. And SPX and XSP? Zero. They're indexes: a number, not something you can buy, so they have no volume of their own. What trades are their options, and the stocks underneath. VWAP is built on this volume too: it sees the underlying, not the options.
Options are another story. Cboe compared the three biggest, in dollars: SPX is about three quarters, SPY about fifteen percent, options on ES about eleven. XSP and options on MES are much smaller, and they're not in that count. And about six SPX contracts in ten expired the same day last year; now it's close to two in three. So most of the options activity is on SPX, and a chart of ES alone doesn't show it.
Day and night
And the clock changes the mix. The index only moves while its stocks trade. At night, the S&P 500 trades mostly through the futures: in our data since June, about a fifth of ES volume trades outside the American cash session. Last year, options on ES traded about seventeen percent outside American hours; SPX options at night, only three or four percent. In the day session, the options weight goes back to SPX.
One reading, two places
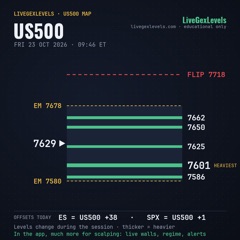
This is what LiveGexLevels puts together. Five instruments on one scale, in SPX points. The walls, estimated from the options of the index, the fund and the futures, are merged and weighted by their size in dollars. A wall seen by only one of the three markets is drawn thinner and fainter. The underlying's volume, the whole family's, is read with the price: volume bars underneath, VWAP on the candles, and the volume profile one click away. The options' volume of SPX, XSP and SPY, for the nearest expirations, sits on the right edge of the US500 chart, strike by strike, with the calls in yellow and the puts in purple.
And there are two charts. On the left, US500: the whole family together. On the right, the instrument you trade: SPX, XSP, SPY, ES or MES, with the same levels already converted to its own price. The two are linked by default: same timeframe, same cursor. A move on the right, you read it against the walls and the options' volume on the left, at the same moment. Reading them together always gives your reading an advantage: more context, never less, whatever instrument you choose.
A few extras
A few extras. First, the volume progression. A bar that's still forming always looks small next to finished bars. So LiveGexLevels compares it with how much each earlier bar had traded at the same second into the bar. While the bar is still open, you see whether it's trading more or less than earlier bars at the same point. And the rounding is built to be cautious: it can make the bar look weaker, never stronger.
Second, the levels over time. The flip leaves a trail of where it stood during the session, and the main walls show an arrow when they got heavier or lighter in the last hour. Third: four times a year SPY goes ex-dividend, and its price drops by the dividend, roughly seventeen to twenty SPX points, while the index doesn't. That's why SPY is never converted with a plain times ten. And fourth: at half past nine New York time, the first SPX value is partly stale, because many stocks haven't traded yet. In our measurements, the gap from what the futures implied was a median of six points, and about one point a minute later. So US500 doesn't take that first value at face value: it waits a minute, until the index has caught up.
In brief
In brief. One index, five instruments, moving together, each at its own price. Two volumes: the underlying's, where the futures and SPY trade and the indexes have none; and the options', about three quarters on SPX. LiveGexLevels shows the first with the price and the second on the right edge, on two linked charts. Read together, they always add context to your reading.
Up next
Coming up in the guide: the dealers' hedging up close. Tell us in the comments which instrument you trade, and what you'd like us to explain. Before risking real money, practise with paper trading. And the guide is free with our newsletter, on livegexlevels.com. And to see the levels live, sign up on the platform: right now there's a launch price, which you keep for as long as you stay subscribed, and a free trial.