LiveGexLevels Guide · Published
Why does the market go against you the second you enter?
You buy, and it drops. You sell, and it climbs back. The market isn't watching you: it goes where the orders are, and where the options market makers' hedging is. Two reasons, one example from a real session on US500, and where to look before you click.
 Watch the video · 4:12
You buy, and it drops
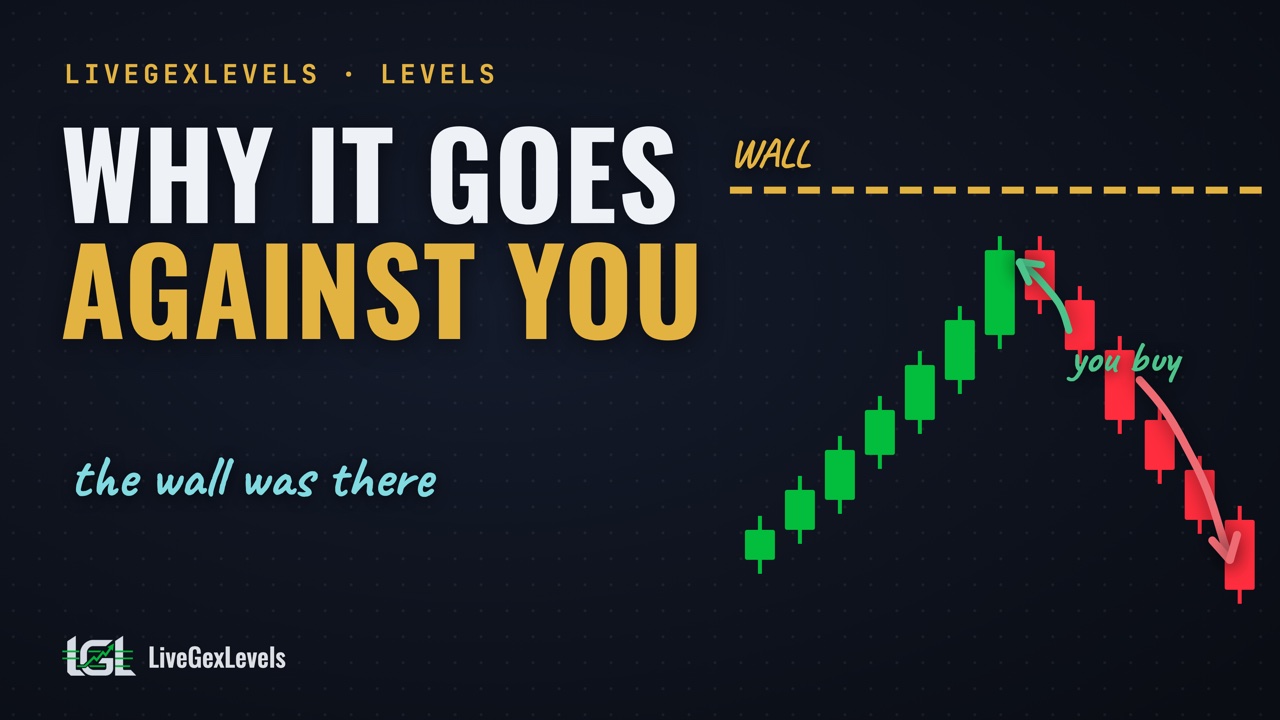
You buy, and it drops. You sell, and it climbs back. It feels as if the market were watching you, waiting for your click to turn. It isn't. But someone does move every time the price reaches a level.
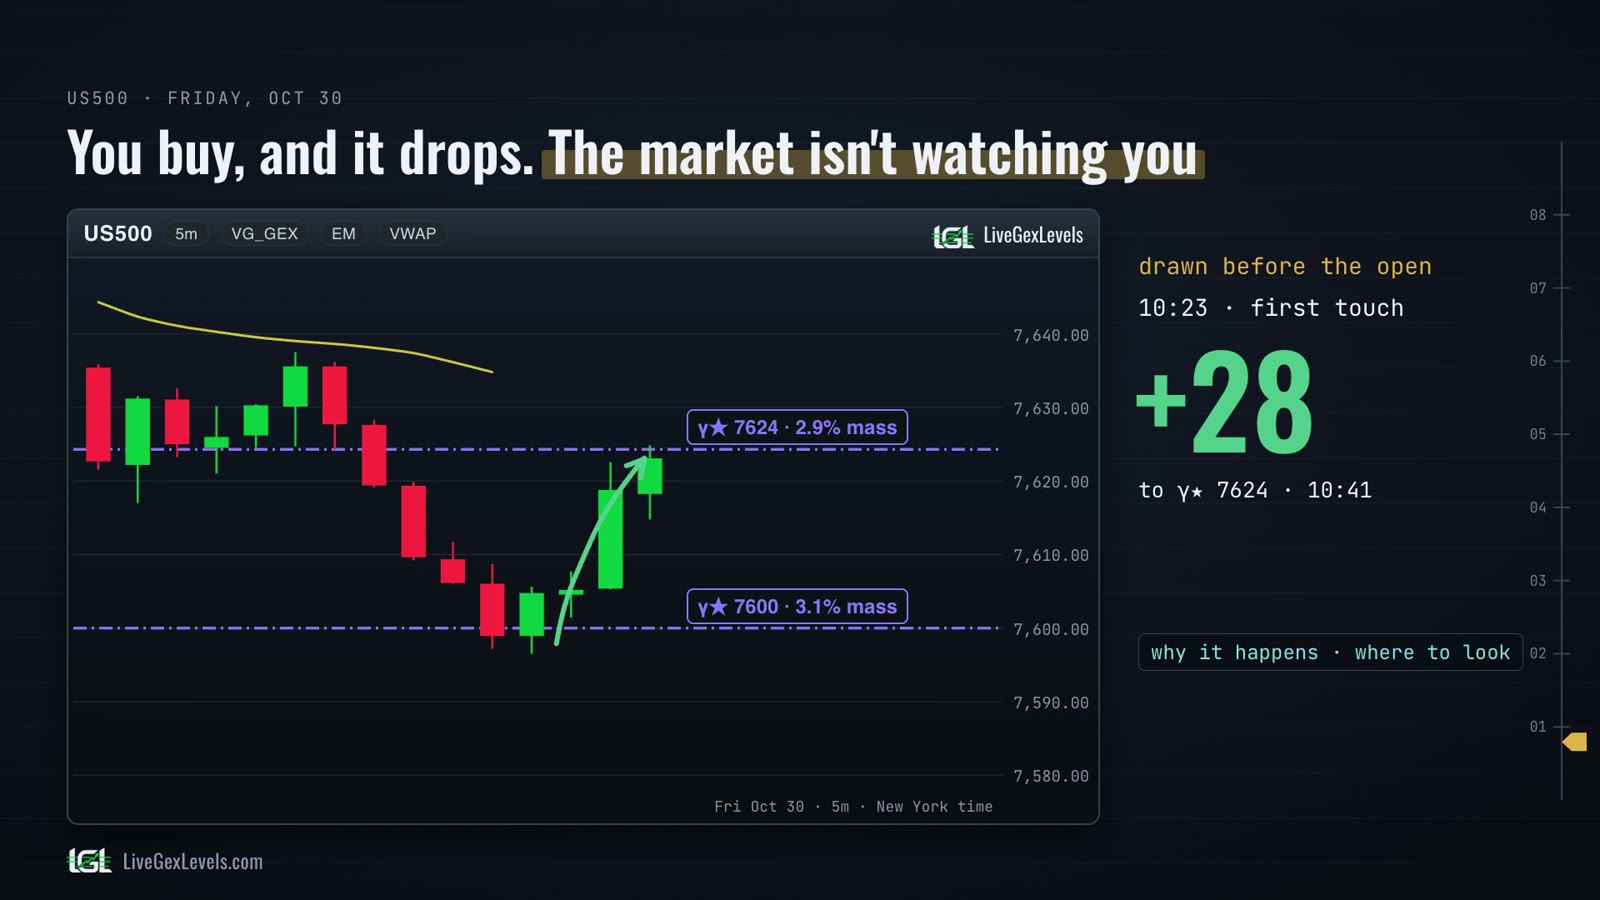
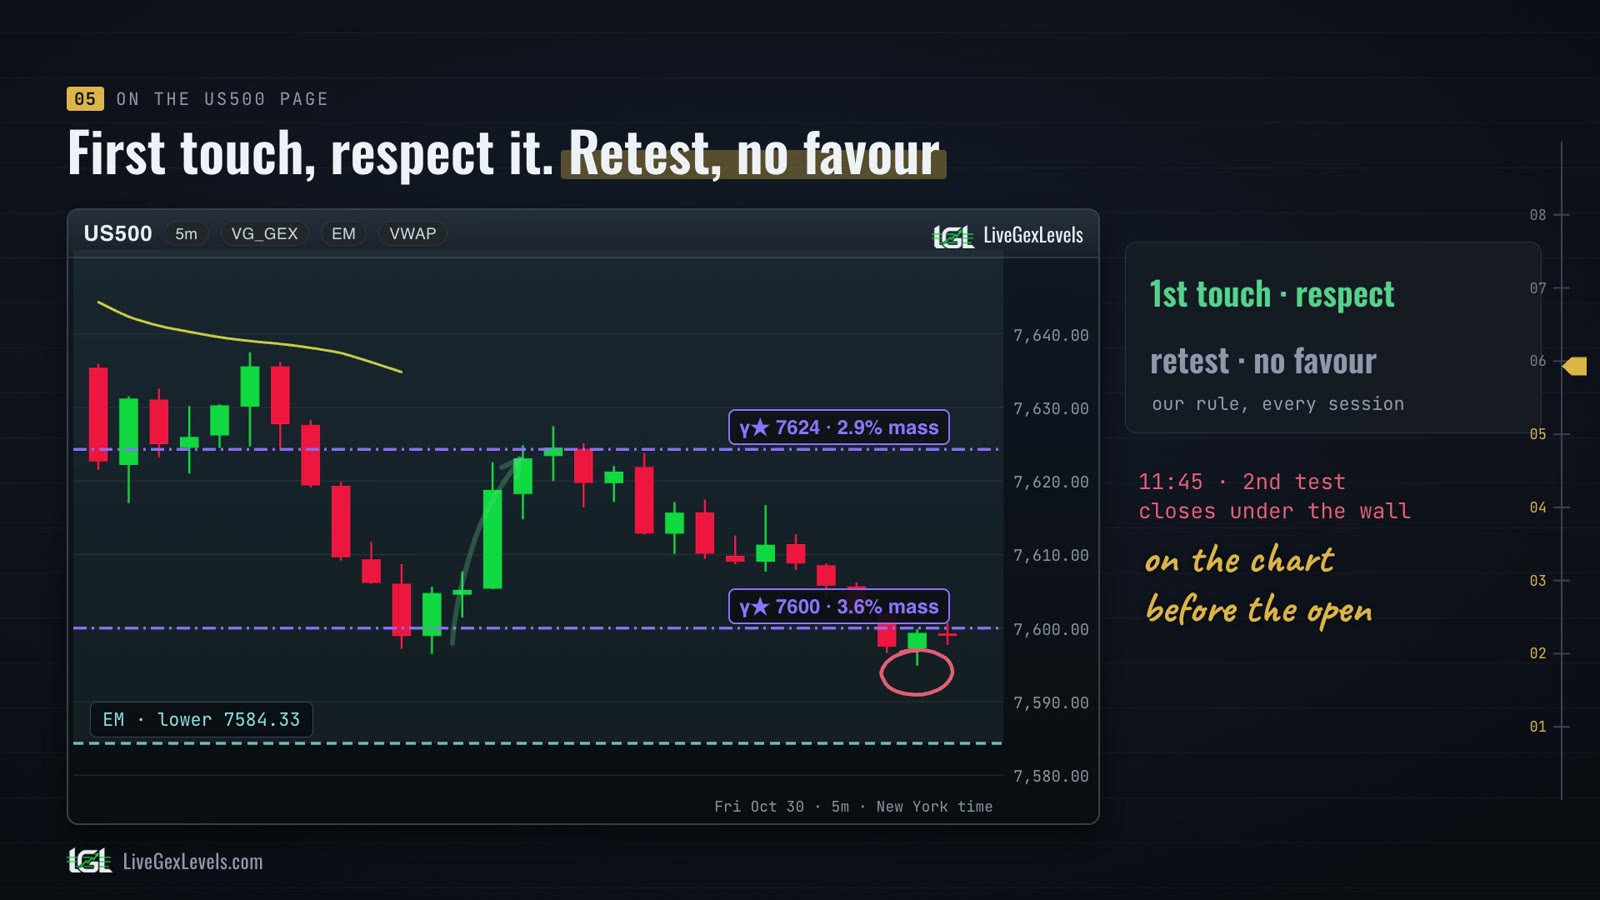
An example from Friday 30 October, on US500. Before the open there was a wall on the chart at 7600. At 10:23 the price came down to it for the first time: it touched it, dipped to 7596.51 at 10:25, a few points under the line, and climbed about 28 points, to the next wall, 7624, at 10:41.
Here's why that happens, and where to look before you click.
Two answers: why, and where to look
The answer comes in two parts. Why it happens: the orders, and the hedging of options. And where to look before you click: the levels where they pile up.
The levels are on the LiveGexLevels page: they are there before the open, and they are sharp in the first minutes of the session. Every evening, on the YouTube channel, there's the reading of the session: which levels held, and which gave way.
Where you enter
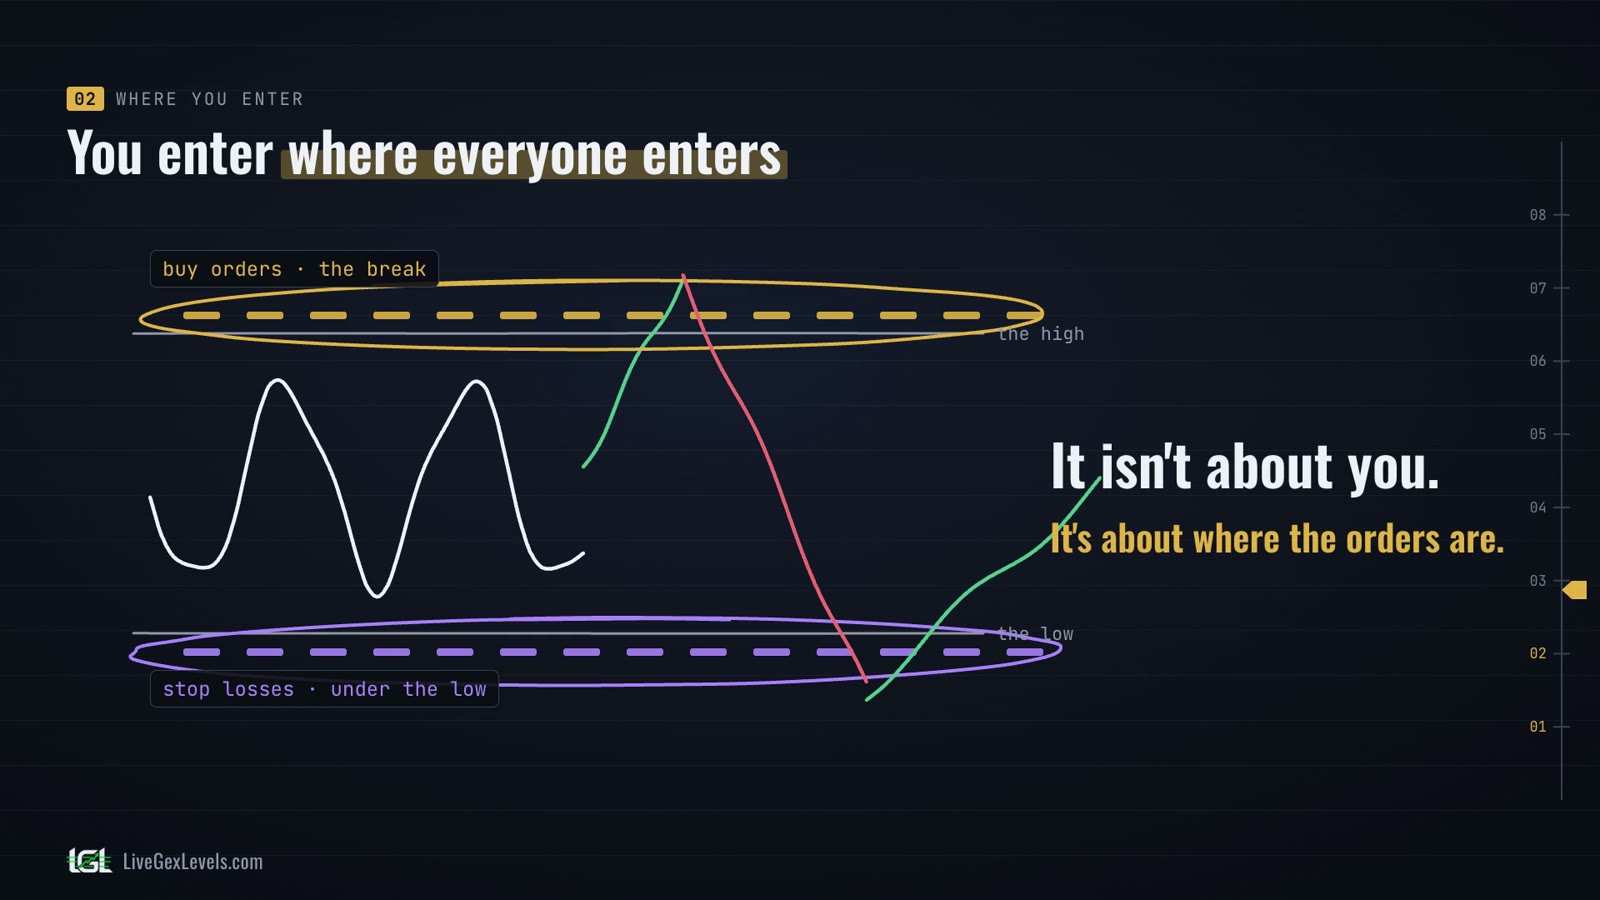
First reason: you enter where everyone enters. The break above the high. The stop just under the obvious low. Those are the places with the most orders: buy orders waiting for the break, stop losses lined up under the low.
So that's where the price goes to find them. And once they're filled, that push is used up, and the price can turn.
It isn't about you. It's about where the orders are. Studies of order books in the currency market found that stop orders cluster near obvious levels, such as round numbers, and that when they are triggered they can extend a move.
The hedging
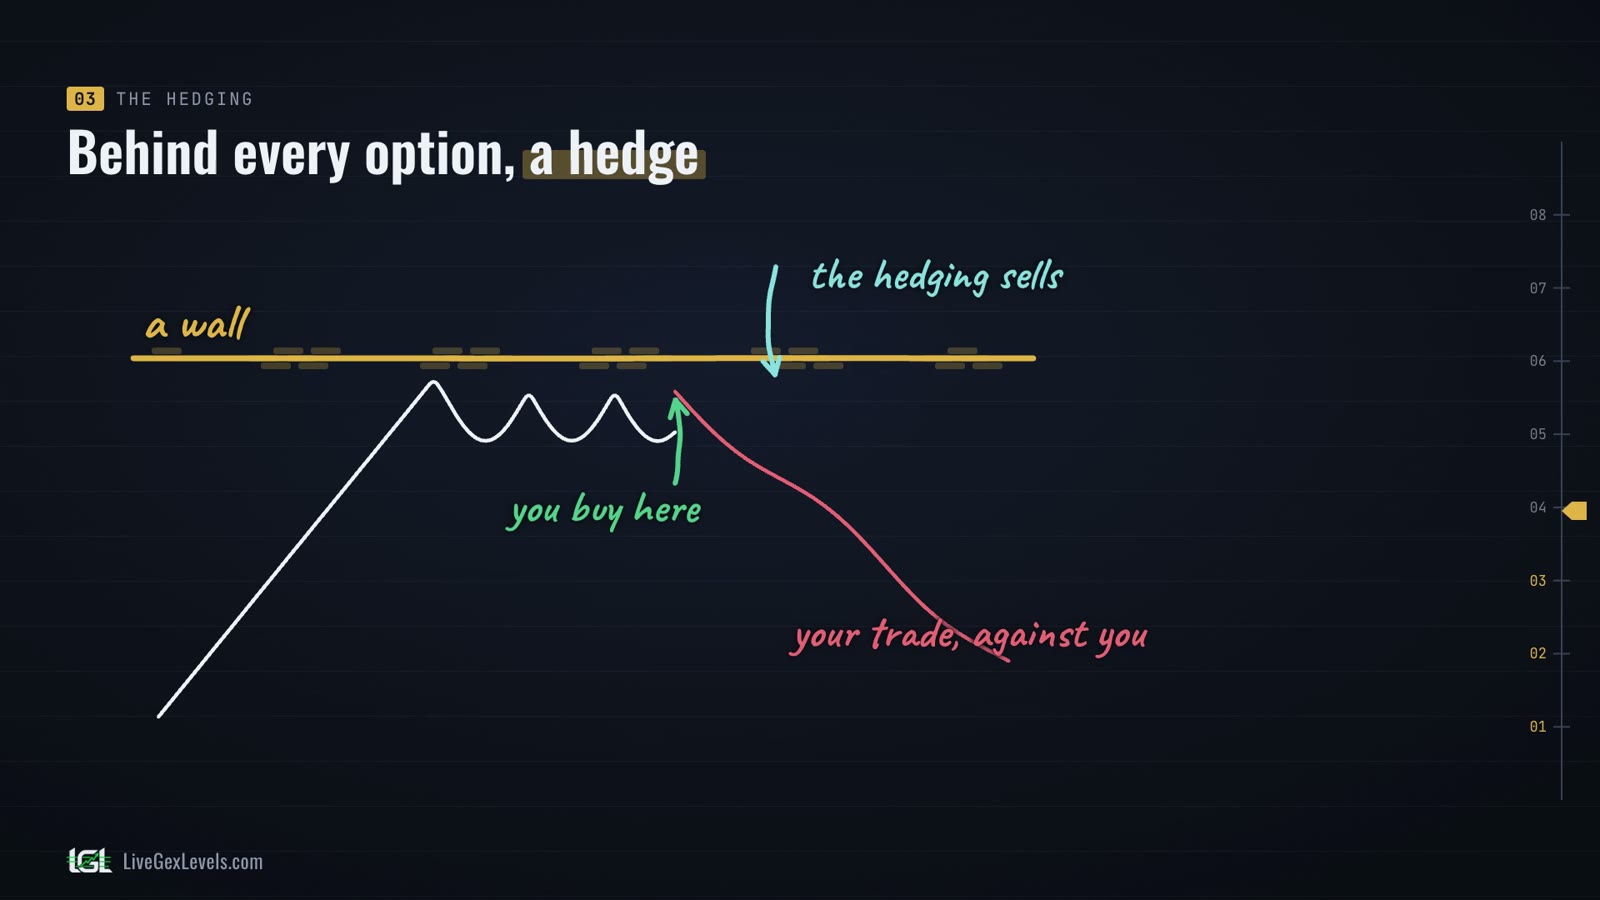
Second reason, the one a chart doesn't show: options. Whoever buys or sells an option usually has a market maker on the other side. He doesn't bet on the direction: he hedges, buying and selling futures on the index, and he adjusts the hedge as the price moves.
Where options pile up on the same strike, his hedging piles up too. That price becomes a wall: a level where, according to the model, the hedging tends to slow the price. A wall is an estimate, not an order in the book and not a barrier.
Now put the two reasons together. You buy the break right under that wall: you're buying exactly where the hedging sells. That's your trade that went against you.
Which side of the flip
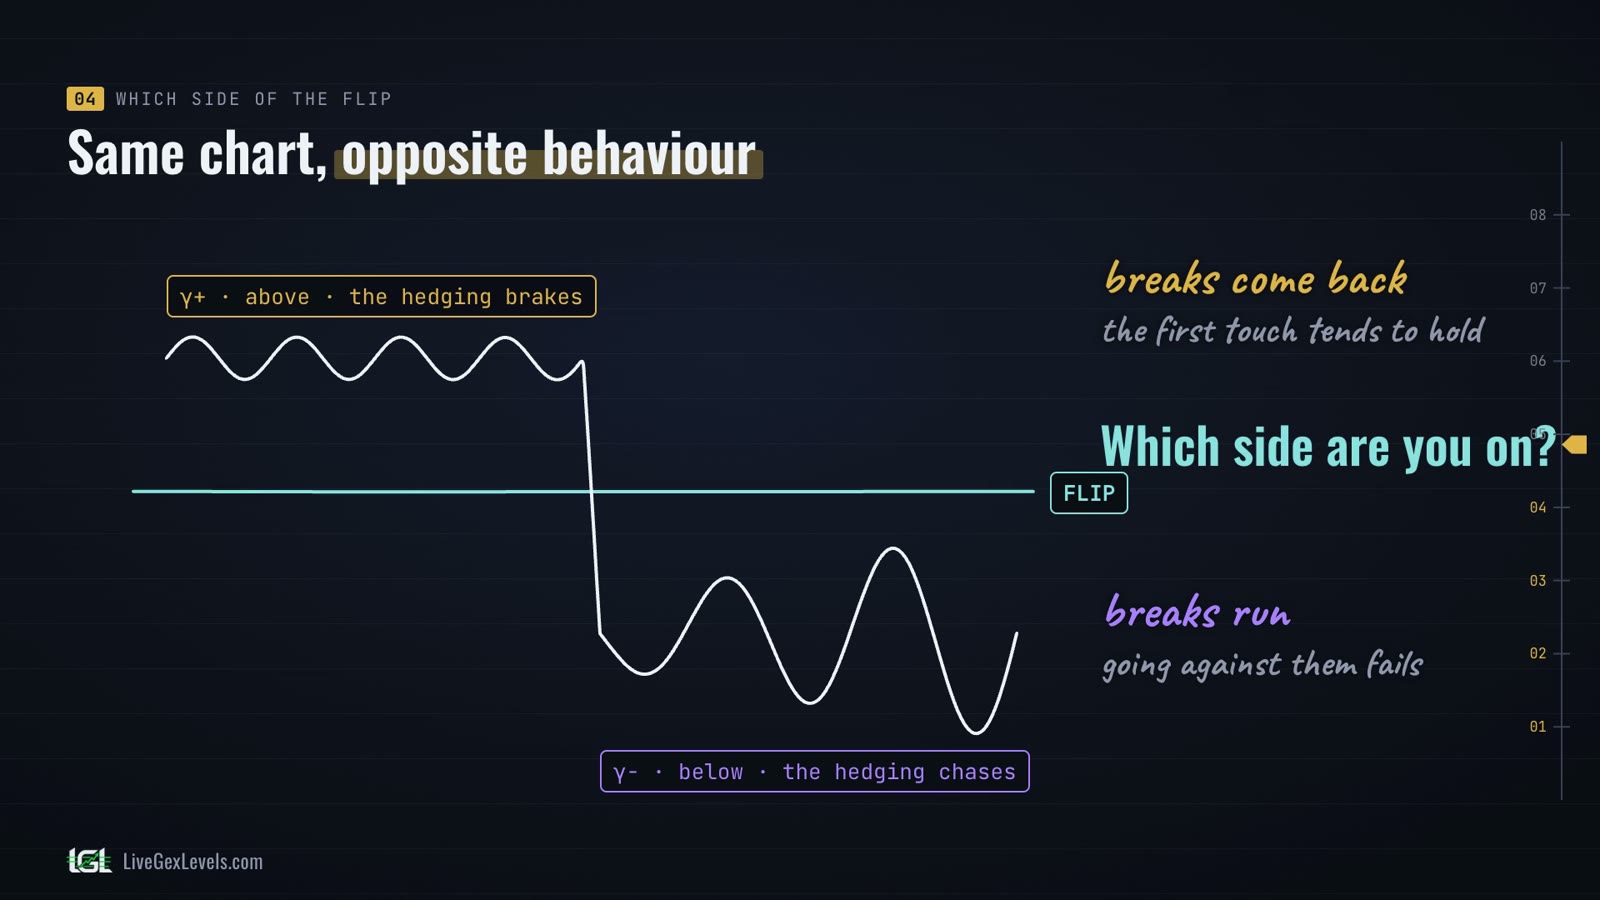
And it flips. Below a level called the gamma flip, the same hedging pushes the other way: instead of selling into rises and buying into falls, it chases the price.
Above the flip, breaks tend to come back, and the first touch of a wall tends to hold. Below it, breaks tend to run, and it's going against them that fails. Same chart, opposite behaviour.
If you don't know which side of the flip you're on, many of your trades may be fighting the hedging. The flip is an estimate too, and it moves every day: the gamma flip article goes through it step by step.
On the US500 page
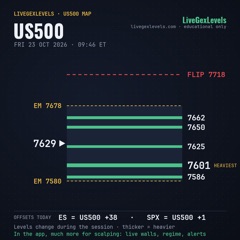
Here's how the page shows it. The dashed lines are the walls, each with its weight next to it. The band is the day's expected move. All the values are US500, the synthetic index of the page, not exchange quotes.
Friday 30 October, 10:23. The price comes down to the 7600 wall for the first time, the heaviest one near the price. It touches it, and climbs 28 points to the next wall, 7624, at 10:41.
The second time, at 11:38, the wall doesn't hold: at 11:45 the price closes under it. First touch, respect it. Retest, no favour.
It's a rule you can only use if the wall is on your chart before the price gets there. This is the reading of a past session, not a signal.
Not every wall holds
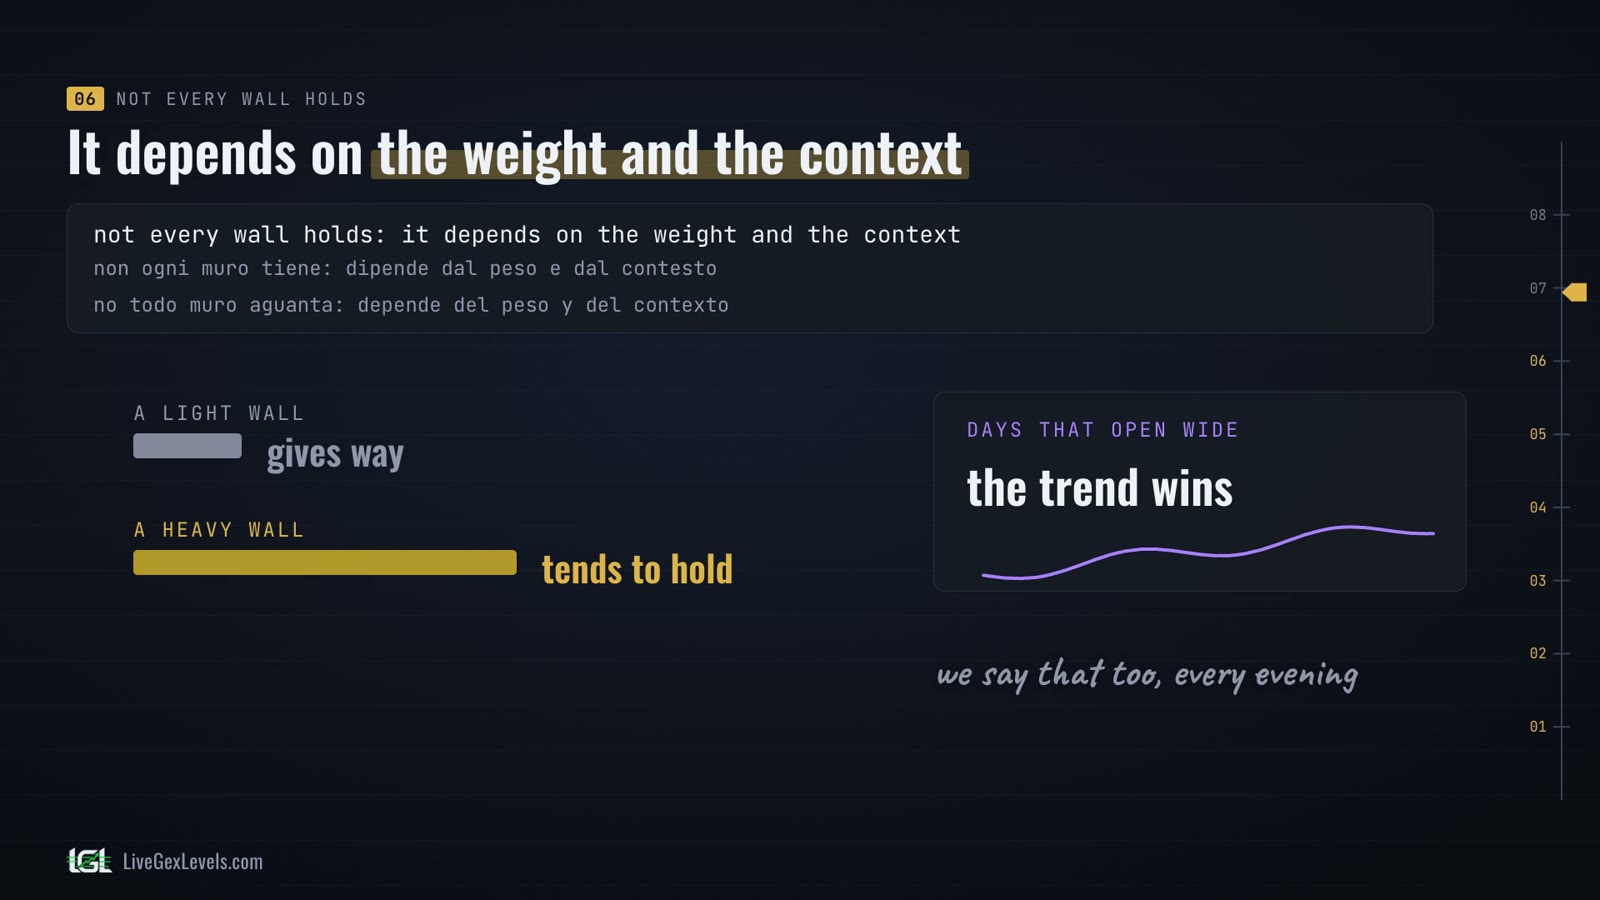
Not every wall holds. It depends on the weight and on the context. A light wall tends to give way; a heavy one tends to hold.
And on days that open wide, the trend wins: walls are the model's estimate of where the hedging piles up, not barriers, and large flows can run through them. The reading of the session on the channel says that too, every evening, walls that didn't hold included.
Your edge
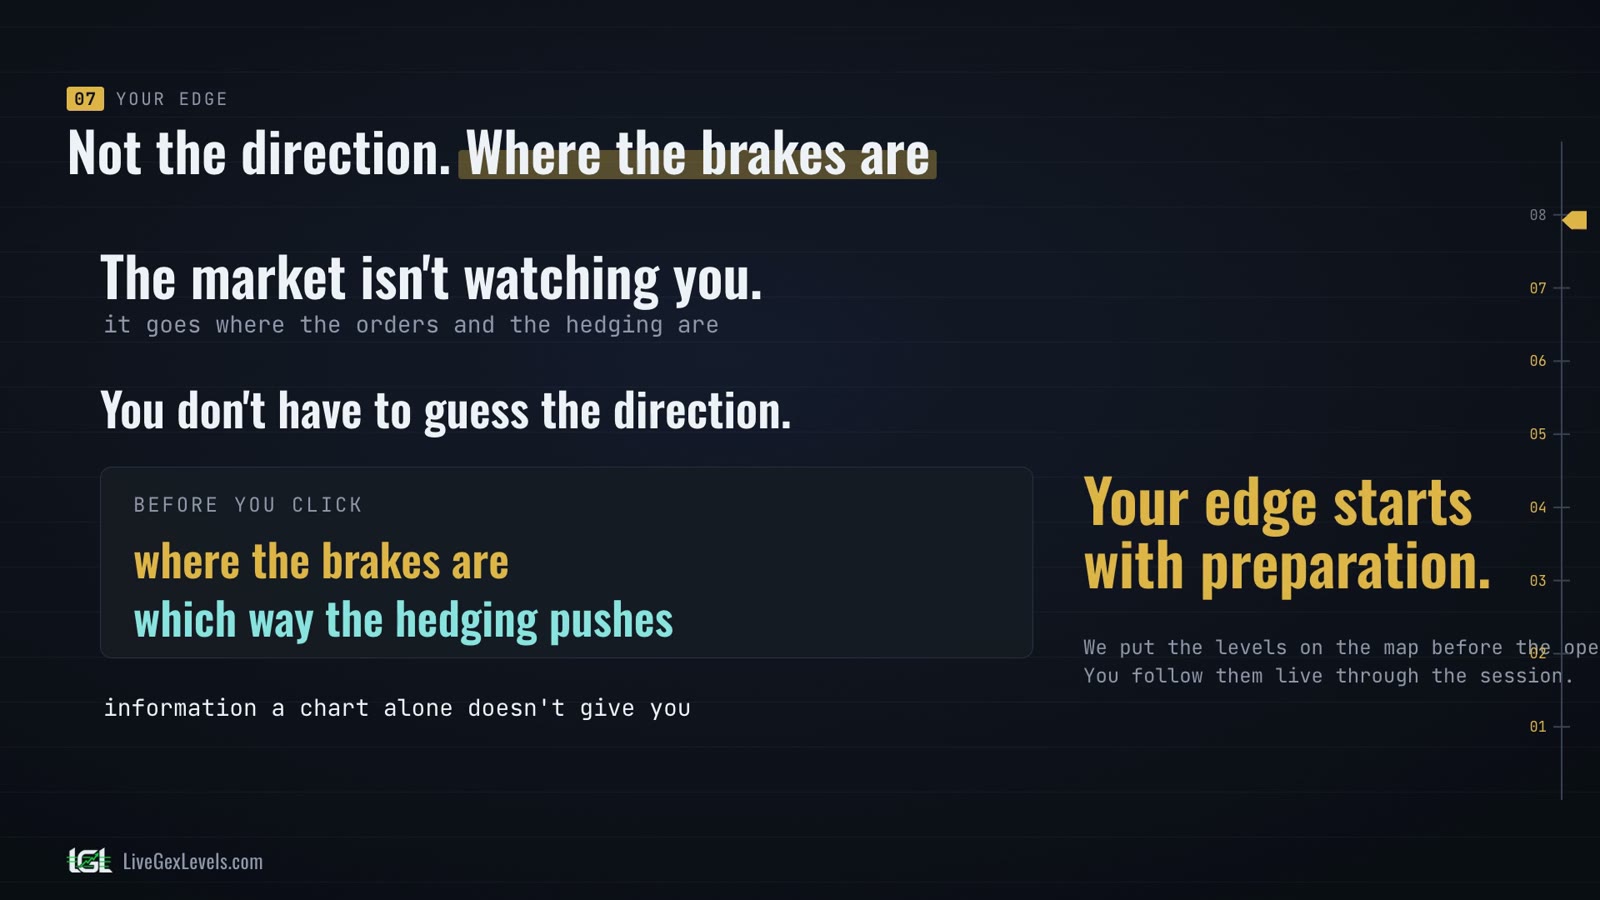
So no, the market isn't watching you. It goes where the orders and the hedging are.
You don't have to guess the direction. You have to know where the brakes are, and which way the hedging pushes, before you click. That's information a chart alone doesn't give you.
Your edge starts with preparation: the levels are on the LiveGexLevels page every day, and the reading of the session is on the channel every evening.
In brief
- The market isn't watching you: it goes where the orders and the hedging are.
- The obvious entries, the break above the high and the stop under the low, are where orders pile up, and the price goes to find them.
- Where options pile up, the market makers' hedging becomes a wall that tends to slow the price: buying the break right under it is buying where the hedging sells.
- Below the gamma flip the same hedging pushes the other way: breaks tend to run.
- First touch, respect it; retest, no favour. Walls are model estimates, not orders and not barriers.
- You don't have to guess the direction: know where the brakes are, and which way the hedging pushes, before you click.
Sources
- SqueezeMetrics (2017): Gamma Exposure white paper (a data provider)
- Gârleanu, Pedersen & Poteshman (2009): Demand-Based Option Pricing, Review of Financial Studies
- Barbon & Buraschi (2020): Gamma Fragility
- Baltussen, Da, Lammers & Martens (2021): Hedging demand and market intraday momentum, Journal of Financial Economics
- Osler (2003): Currency Orders and Exchange Rate Dynamics, Journal of Finance (where stop and take-profit orders cluster)
- Osler (2005): Stop-loss orders and price cascades in currency markets, Journal of International Money and Finance
More from this series
Read next
See the levels live
Seeing where dealers have to hedge is information a chart alone doesn't give you. Your edge starts with preparation.
Card required; after the trial the subscription renews at the launch price. For educational purposes only, not financial advice.