LiveGexLevels Guide · Published
Who moves the price? Gamma exposure (GEX) explained
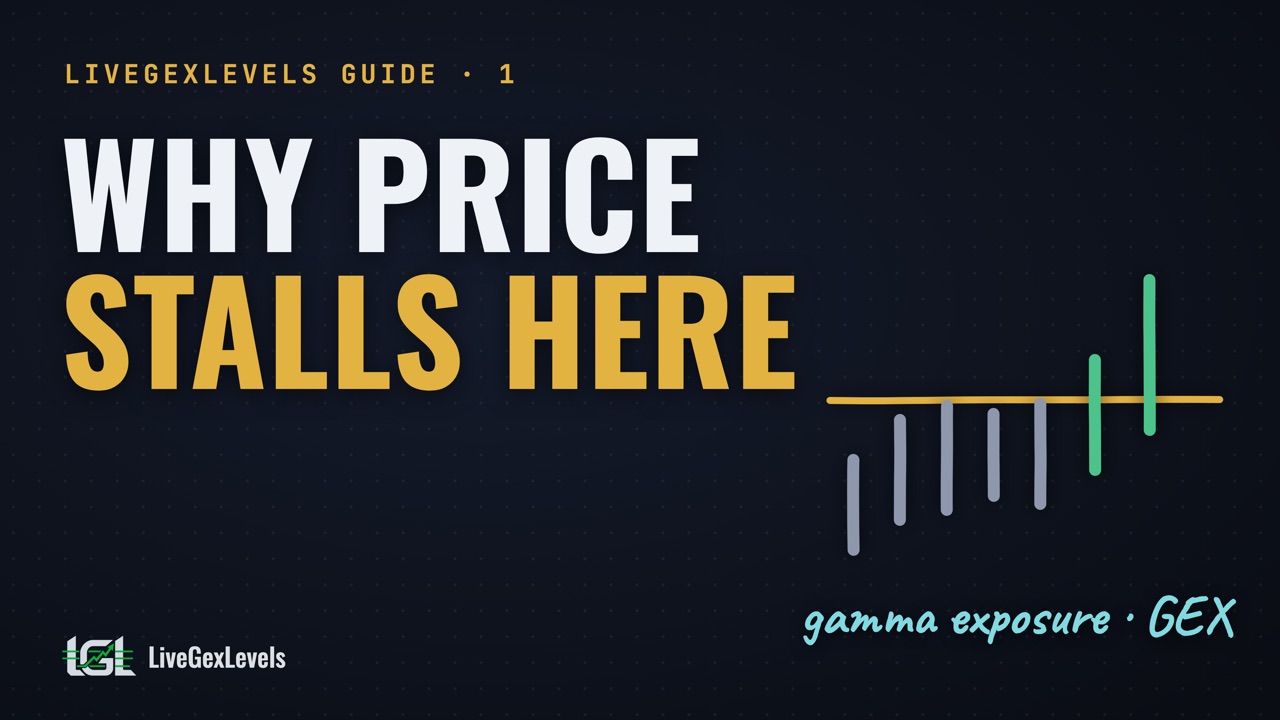
Price stalls at the same level once, then again, and one day it runs straight through. Someone has to trade at that price: the dealers on the other side of options, and their hedging.
 Watch on YouTube · 5:36
Three forces
On a chart of the S&P 500 the price can stall at the same level once, then again, and one day run straight through. It isn't your indicators doing that, and it isn't yesterday's high. At that price someone actually has to buy or sell. To find out who, start from what moves the index during the day.
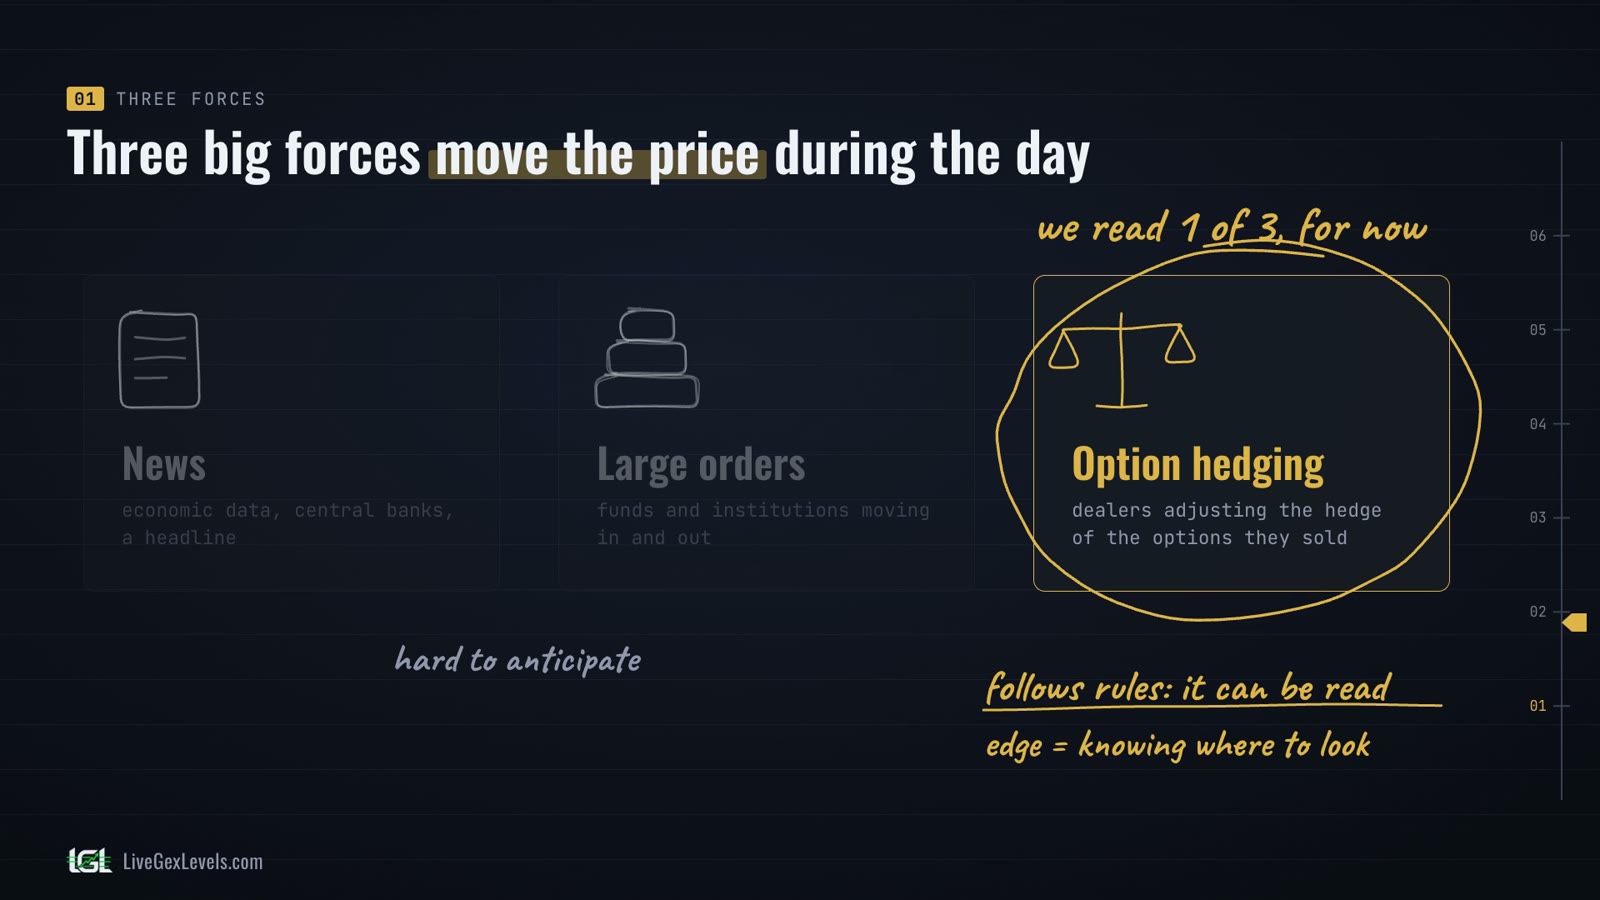
There are three big forces. News: economic data, central banks, a headline. Large orders: funds and institutions entering or leaving the market. And the hedging of options.
The first two are hard to anticipate: you rarely know in advance when a headline will land or when a fund will start to move. The third is different. It follows rules, and that means it can be read.
So let's be clear about the scope: this series reads one force out of three. That's where an edge is possible: knowing where to look before the price gets there. For now, only there.
Why options
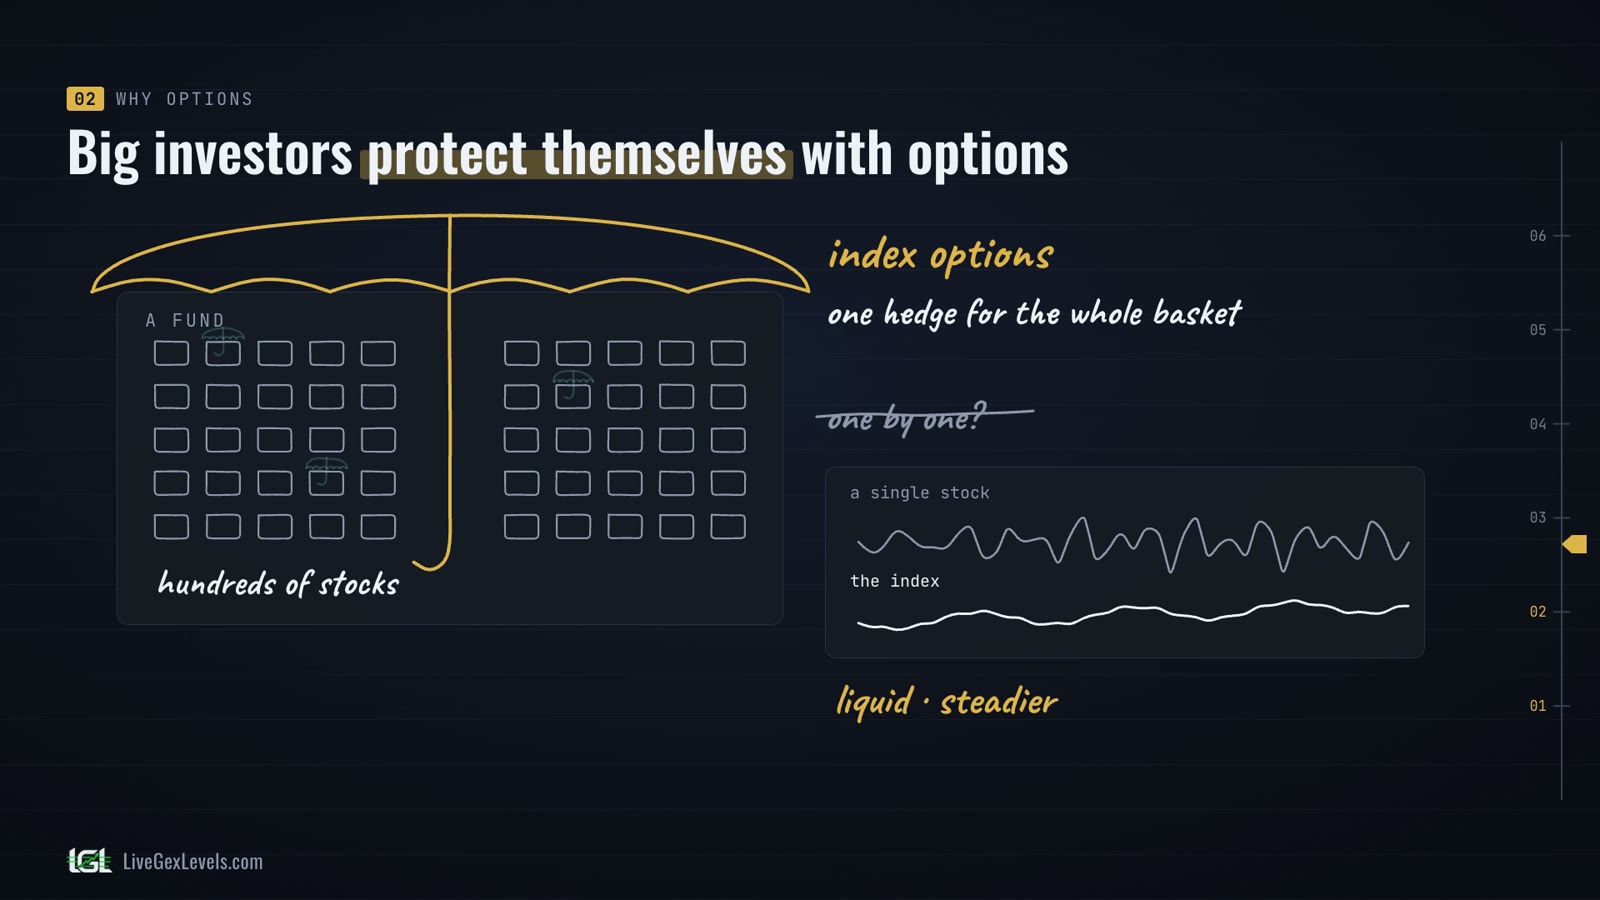
Why options at all? Because they are one of the main ways big investors protect themselves. Options have many uses, and the coming episodes go through them step by step. For now one is enough: they can protect a portfolio against falls, like an insurance policy.
And why the index? Think of a fund that owns hundreds of stocks. It doesn't hedge them one by one. It buys or sells options on the index instead: one instrument covers the whole basket. The index is liquid, and it is steadier than a single stock.
Add it up across all the investors doing the same and the volumes are huge. That's why you often hear that options move the market. Taken literally, it isn't so: an option, on its own, doesn't buy or sell the index. But every option has someone on the other side, and that's where the story goes on.
The dealer
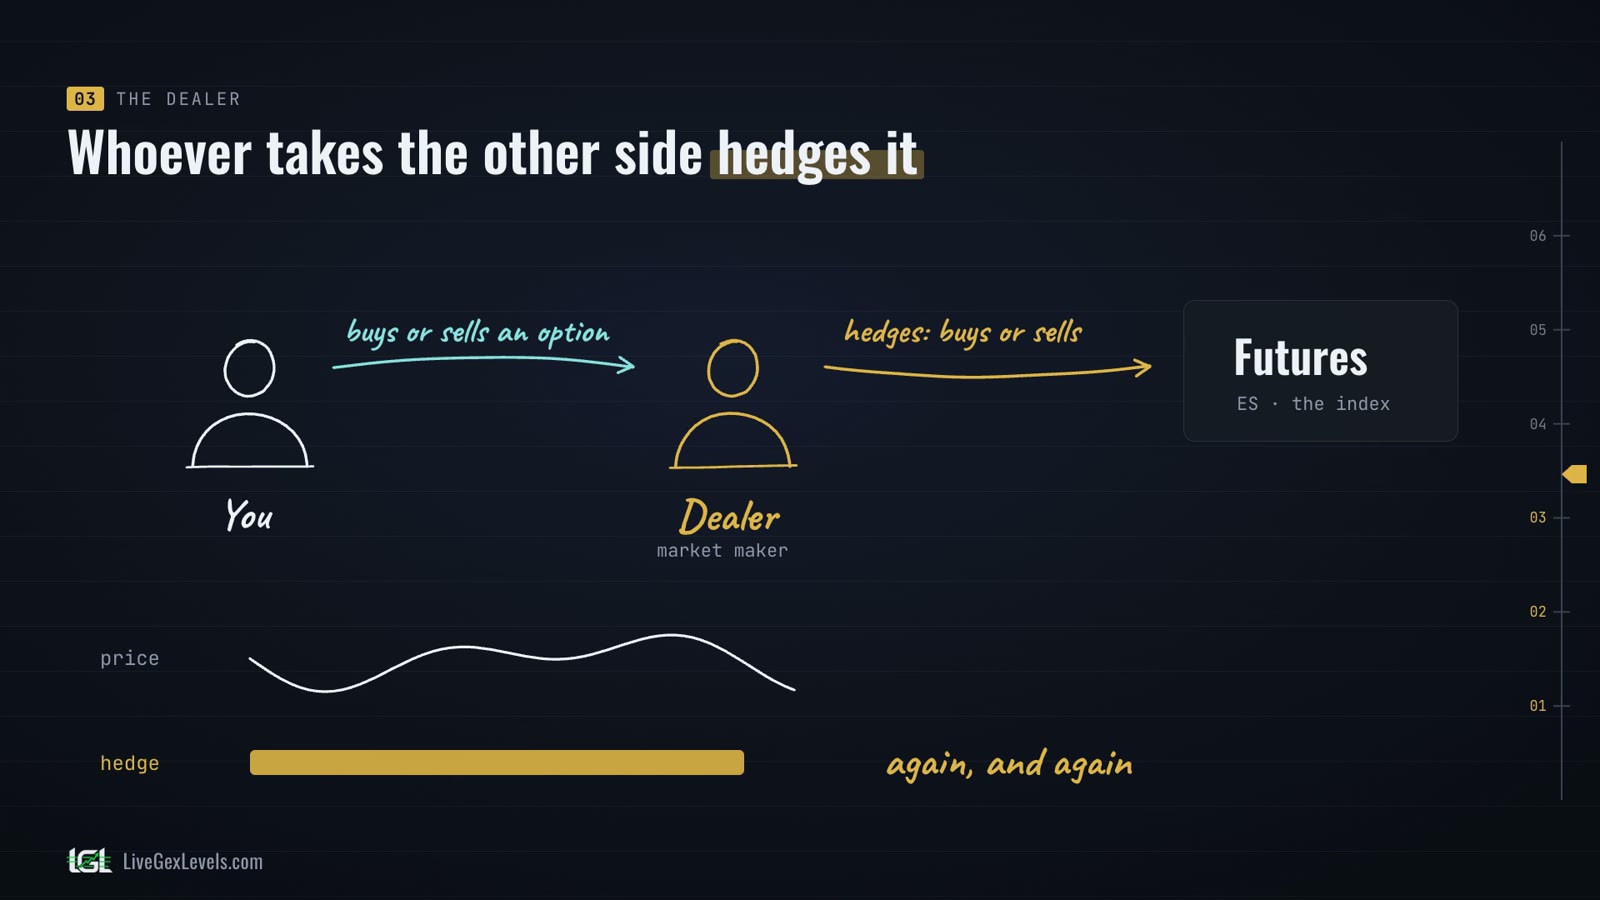
On the other side of an option there is usually a market maker: the dealer. It works both ways: whether you buy an option or sell one, the dealer doesn't want to bet on where the market goes.
So the dealer hedges the position, buying or selling the underlying in the right amount. And the right amount doesn't stay fixed: as the price moves, the hedge has to be adjusted, again and again.
Now multiply that by every option that's still open. All that hedging is real buying and selling, every day, big enough to push the price. That's what «options move the market» really means: not the options themselves, but the hedging behind them.
GEX and the walls
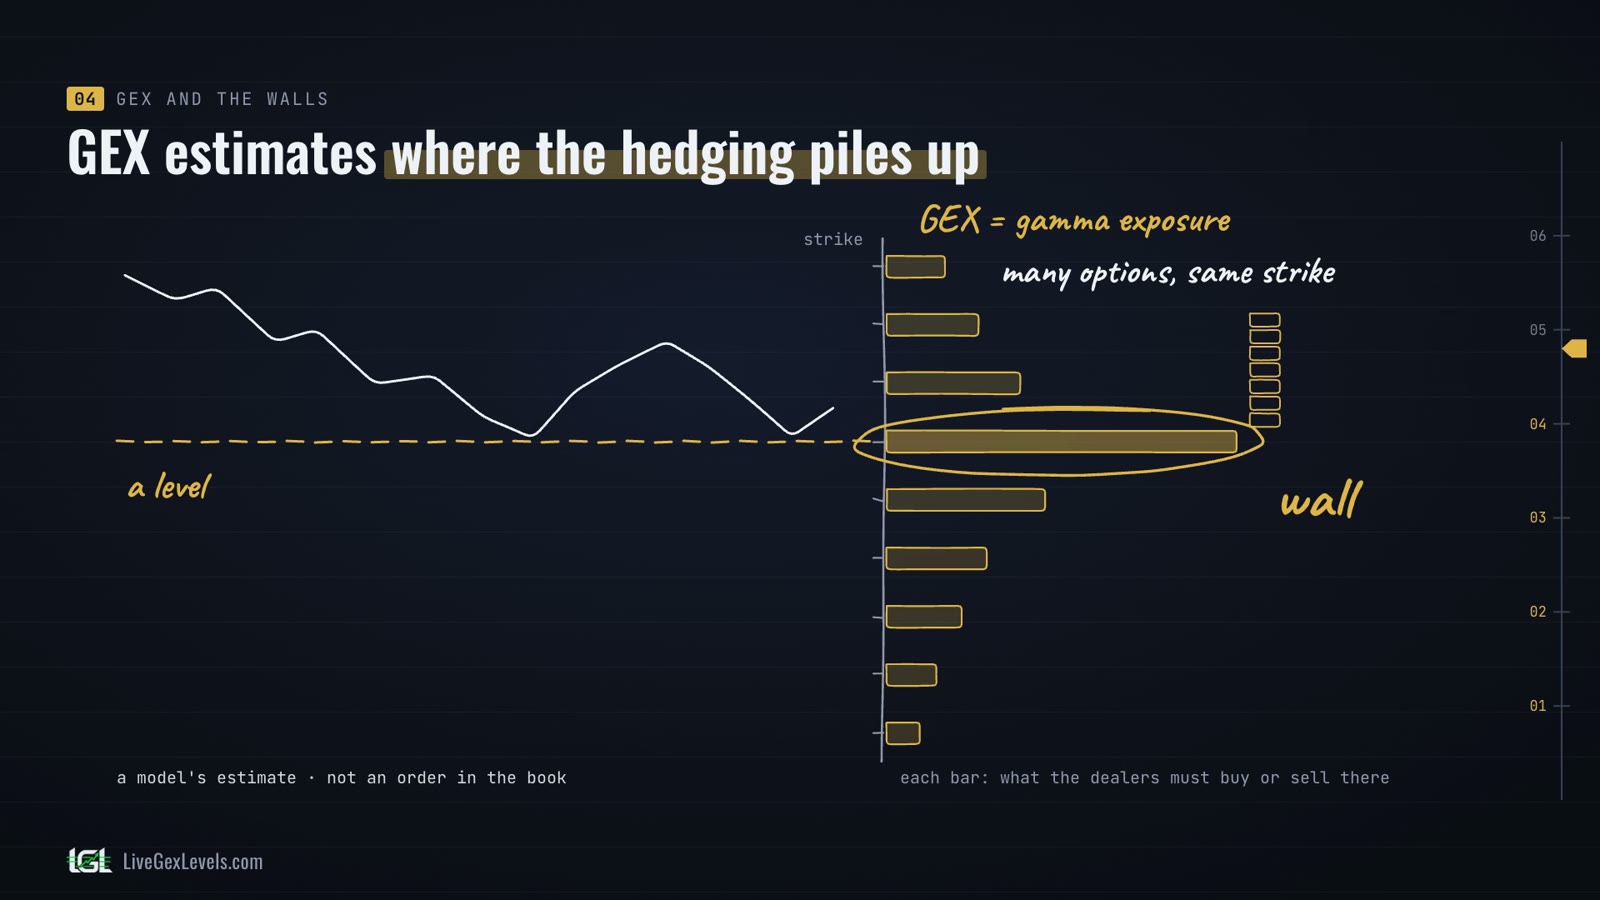
If all that hedging moves the price, the next question is where it piles up. That's what gamma exposure, GEX, estimates, price by price: how much the dealers must buy or sell when the price moves.
Where many options sit on the same strike, the hedging piles up. That price becomes a level, and when the level is heavy, we call it a wall.
One point matters more than any other: a wall is an estimate from a model, not an order waiting in the book. It isn't something you can see in the order book: it marks where, according to the model, the dealers' hedging piles up.
Back to the chart
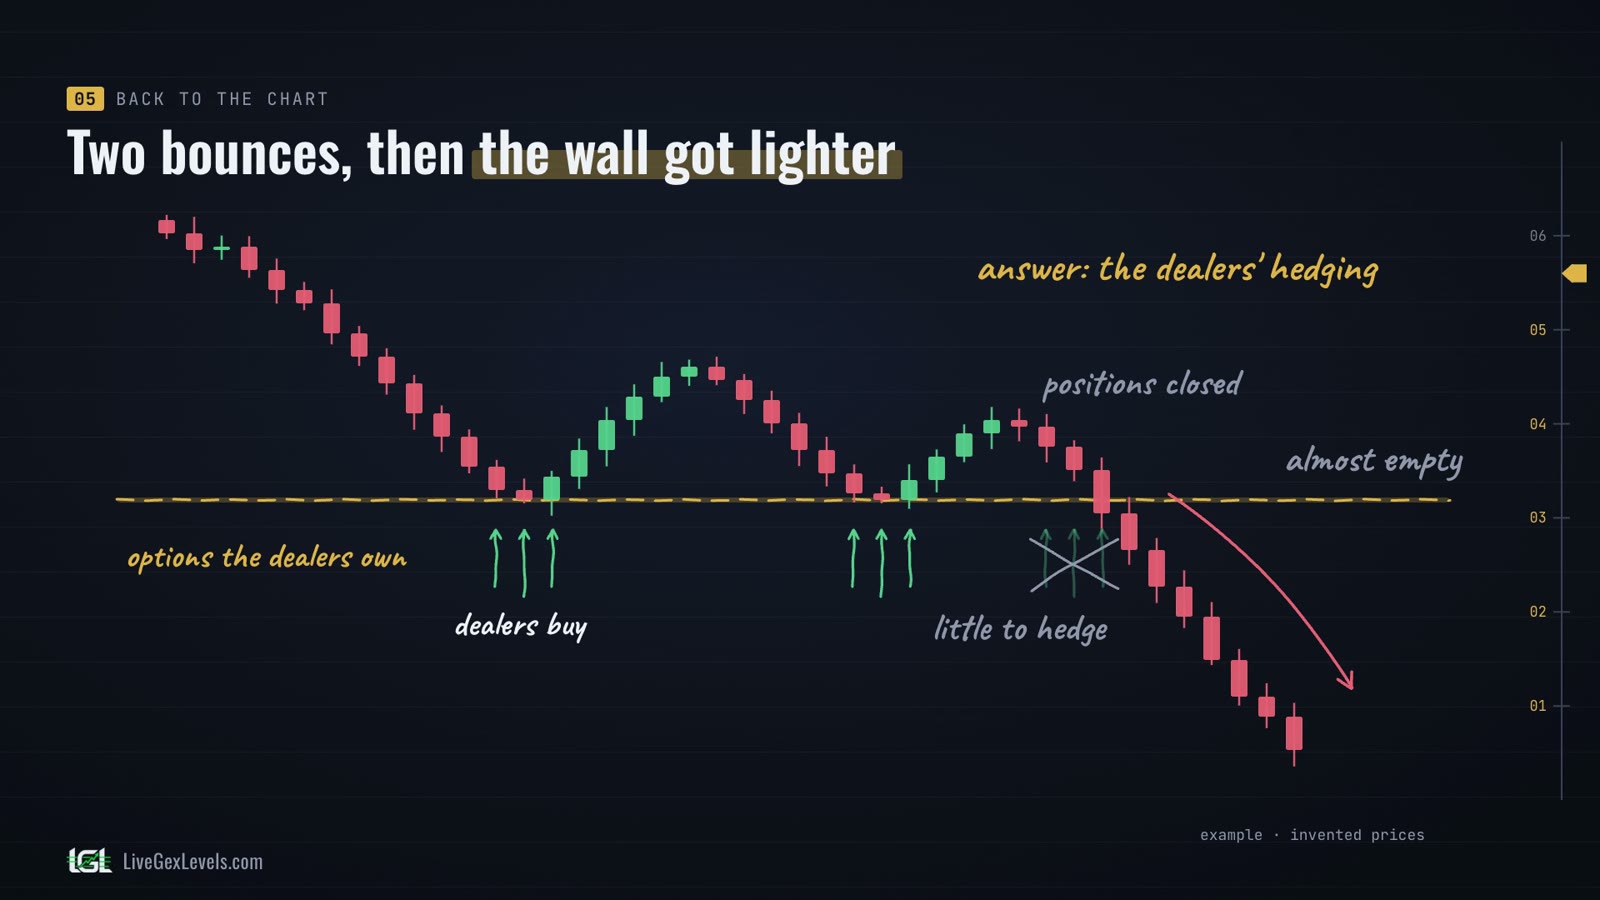
Now back to the chart from the start. The first two times, the price came down onto a heavy wall made of options the dealers had bought. As the price got close, the dealers had to buy the underlying to stay hedged, and that buying helped the price bounce back up.
But between one touch and the next, positions were being closed, and the wall kept getting lighter. On the third touch there was almost nothing left to hedge. The dealers no longer had to buy, and the price went straight through. That's the answer to the opening question: the dealers, and their hedging.
It's only one way it can play out. Here the hedging put the brakes on the drop; other times it does the opposite and amplifies the move. And it remains one force out of three: news and large orders can override any wall. The coming episodes go through these dynamics in detail.
The example also explains the name. The wall that held twice was almost empty by the third touch, so the idea is to follow the GEX levels and how they change throughout the session: Live, GEX, Levels. Put together, LiveGexLevels.
In brief
- Three forces move the index during the day: news, large orders and option hedging. The first two are hard to anticipate; the third follows rules and can be read.
- Big investors protect themselves with options on the index: one instrument covers the whole basket.
- Dealers take the other side and hedge by buying or selling the underlying: that hedging moves the price.
- GEX estimates where the hedging piles up: the levels, and the heaviest ones, the walls. A wall is a model's estimate, not an order.
- Walls change during the session: follow the levels and how they change.
More from this series
Read next
See the levels live
Seeing where dealers have to hedge is information a chart alone doesn't give you. Your edge starts with preparation.
Card required; after the trial the subscription renews at the launch price. For educational purposes only, not financial advice.