LiveGexLevels Guide · Published
Negative gamma: what does it mean?
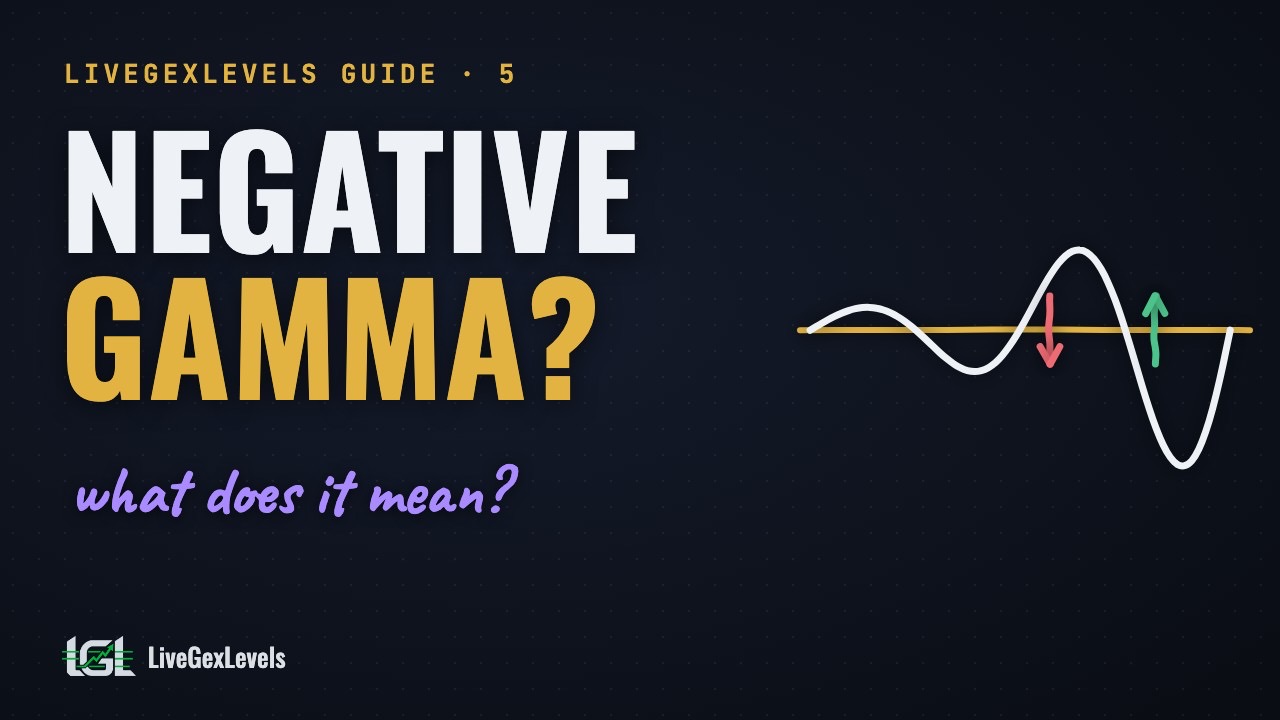
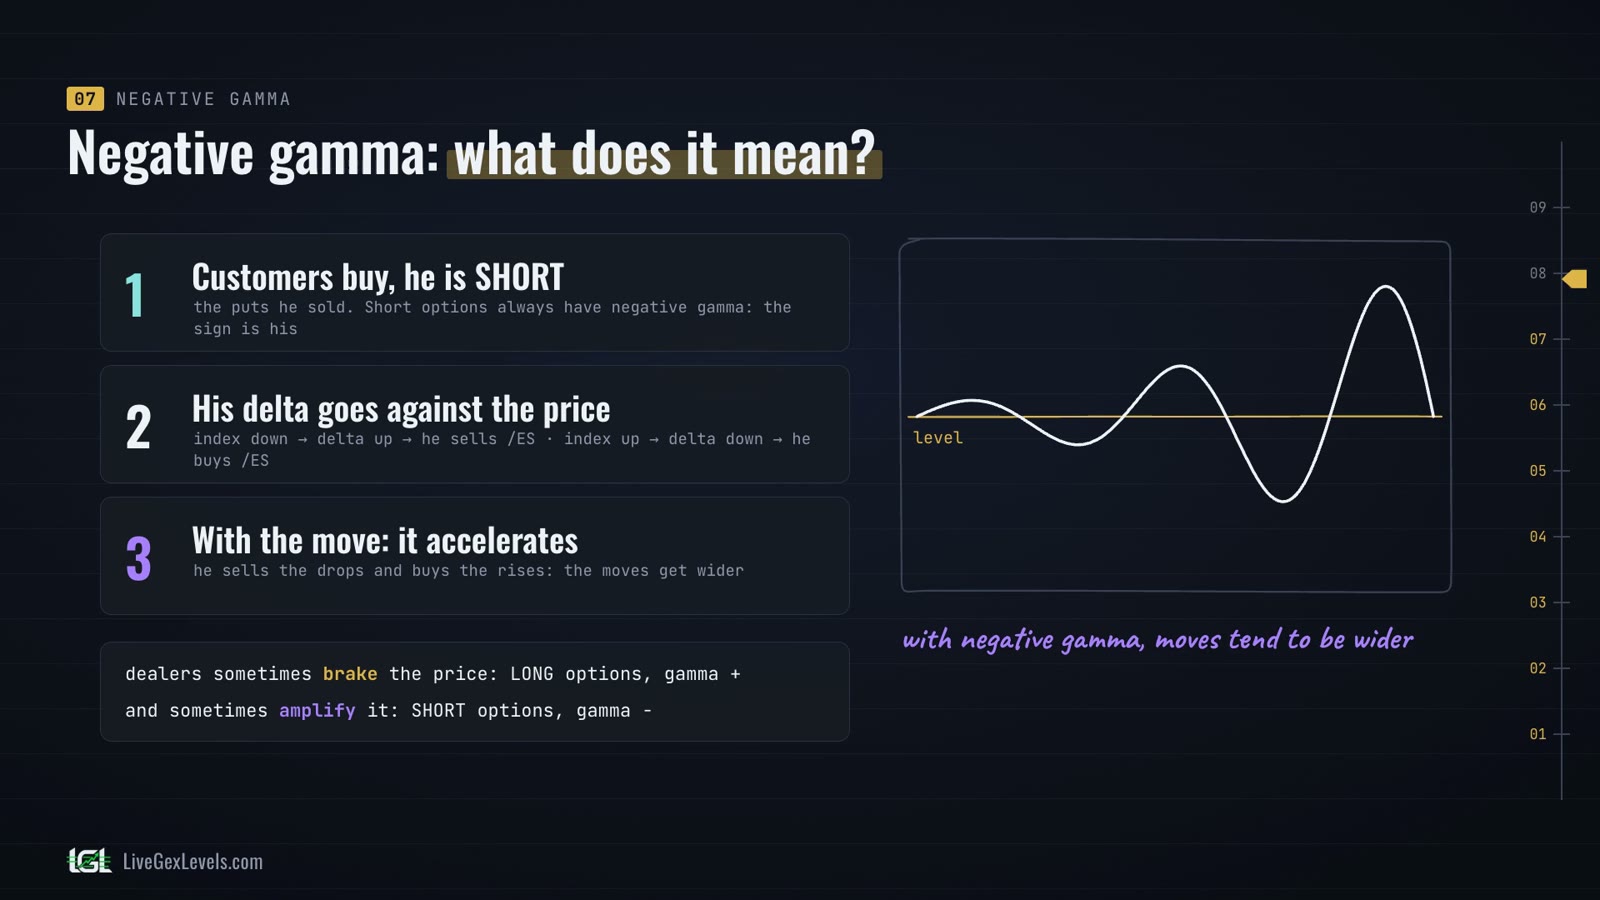
Near a level the price falls and someone sells even more; it rises and someone buys; and the moves get wider. That someone is often a market maker who is short options and hedges his delta: negative gamma means he trades with the move, so the moves tend to get wider. It doesn't tell you which way.
 Watch on YouTube · 11:01
The other side
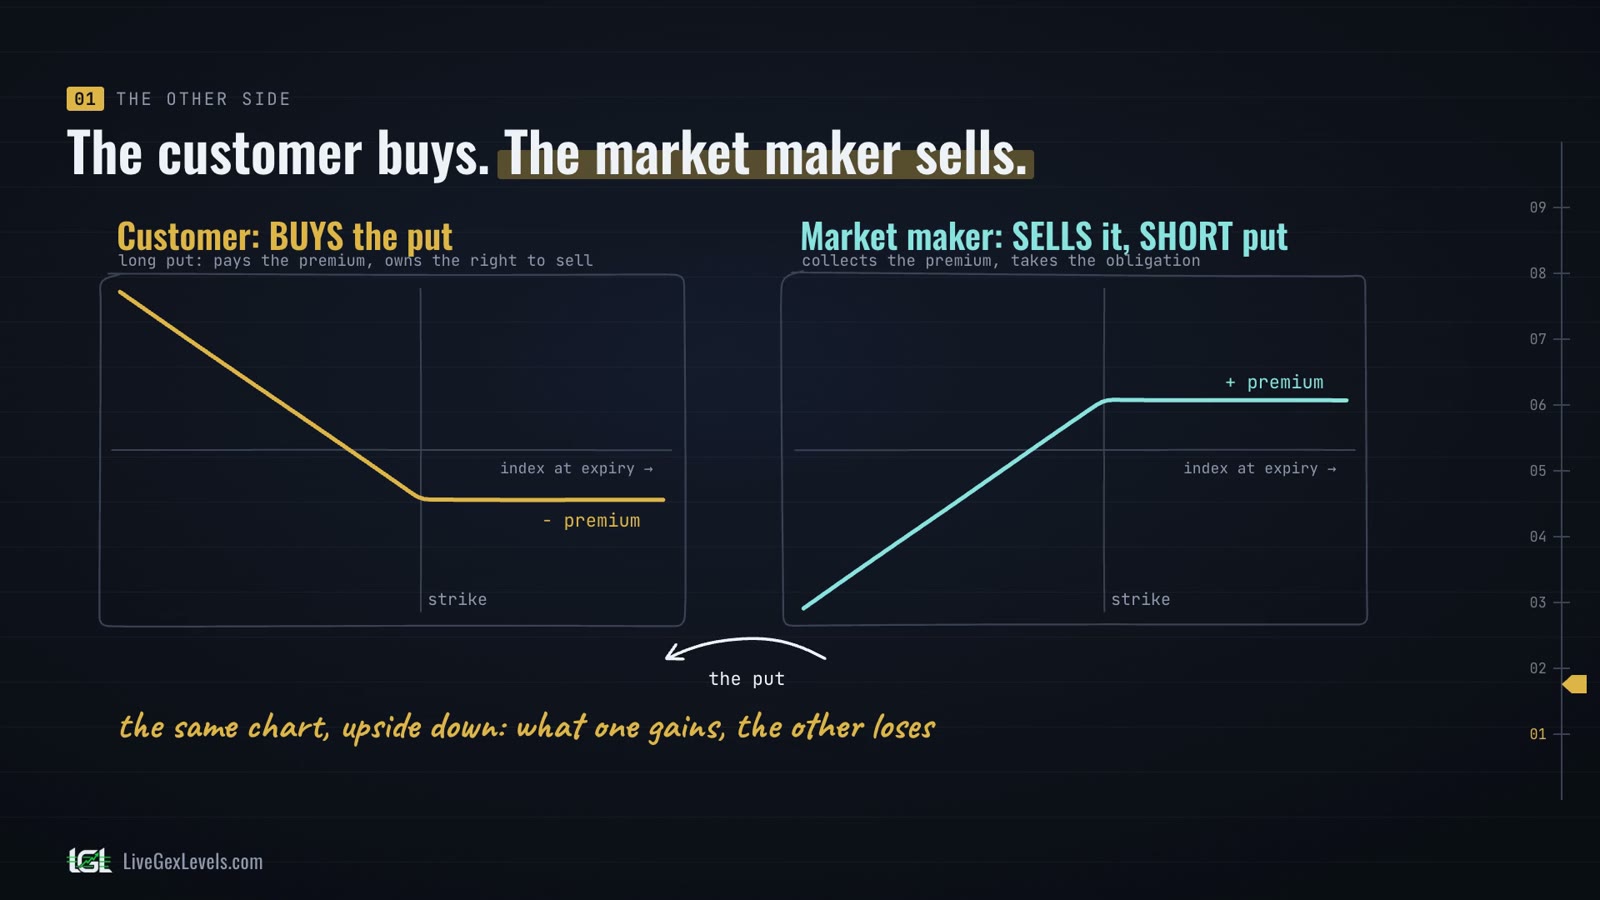
In the previous episode, Guide #4, customers sold calls. Now the mirror image: a customer buys a put, to protect a portfolio, like an insurance policy. Someone sells it, and most of the time it's a market maker.
The customer buys: he pays the premium and owns the right to sell at the strike. The market maker sells: he is short the put, collects the premium and takes on the obligation. At expiry the two charts are the same hockey stick, upside down: what one gains, the other loses.
The long put has its own episode in Options School. Here, we follow the market maker.
The put's delta
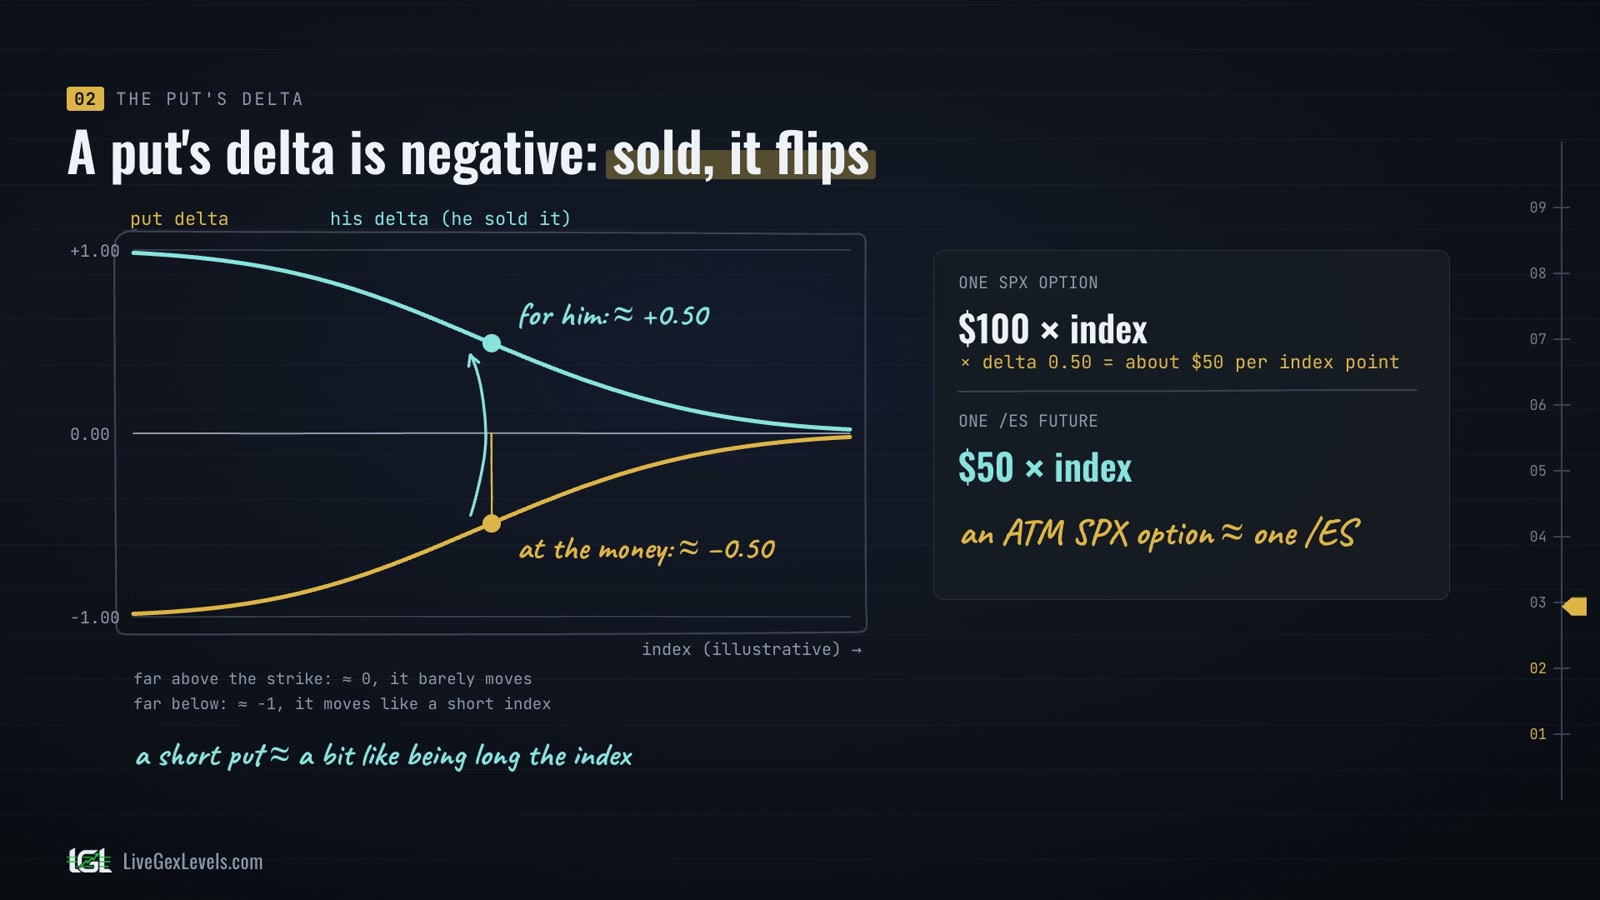
To hedge, he looks at delta again. A put gains when the index falls, so its delta is negative. Far above the strike, the put barely moves: delta is close to zero. Far below, it moves like a short index: delta is close to minus one. At the money, delta is about minus a half.
But he sold the put, so for him the sign flips: plus a half. Selling a put is a bit like being long the index.
And as we saw last time, one at-the-money SPX option moves about like one ES: an SPX option is worth 100 dollars per index point, so about 50 dollars a point with delta at one half, and an ES future is worth 50 dollars a point.
The hedge
Customers buy 1,000 puts at the money, and the market maker sells them: he is short 1,000 puts. For him, it's as if he had bought about 1,000 ES: he gains if the index rises and loses if it falls. The same bet as last time, so the same first move: he sells about 1,000 ES. Puts plus ES: net delta, zero. So far, nothing new. The difference comes when the price moves.
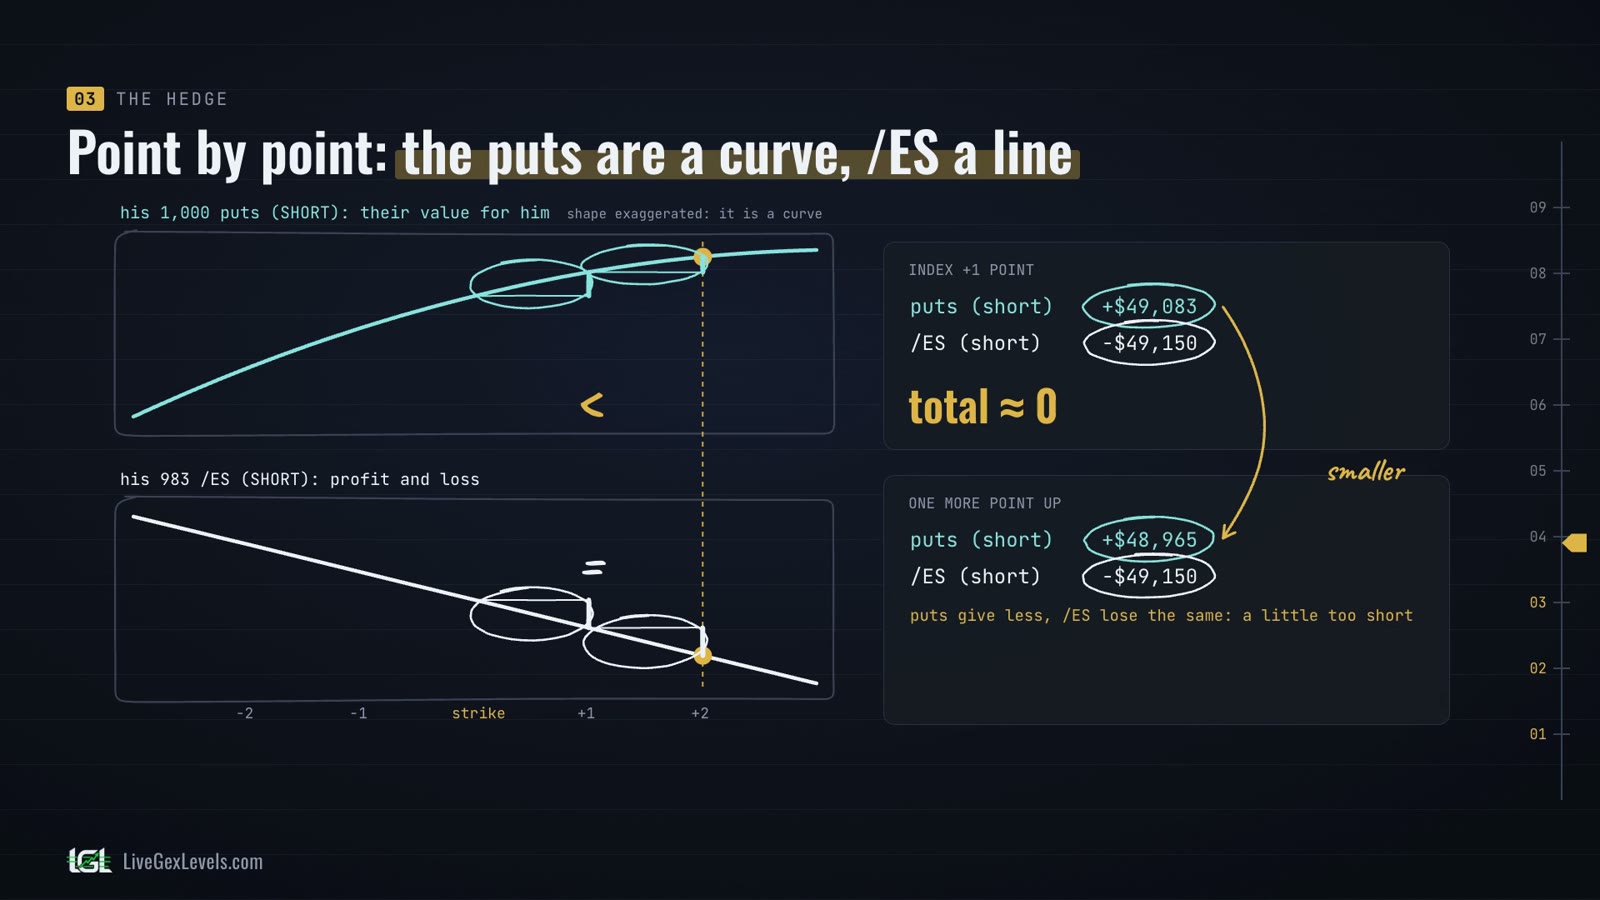
Move the index one point at a time. One point down: the puts cost him about 49,200 dollars, and the ES he sold gain about the same. Total: about zero. One more point down, and the puts cost him a little more, because their delta has grown, while the ES gain exactly the same as before. Now he is a little too long. To stay balanced he has to sell more ES, and selling while the price falls tends to push it further down.
Now the other way. Back to the strike, and one point up: the puts give him about as much as the ES lose. One more point up, the puts give a little less, and the ES lose the same. Now he is a little too short, so he closes some of his short ES, which means buying. And buying while the price rises tends to push it further up.
Every figure here and in the video comes from a Black-Scholes model on an illustrative index (7,800, volatility 15%, rate 0, 1,000 puts): model numbers, not market quotes.
Chasing the price
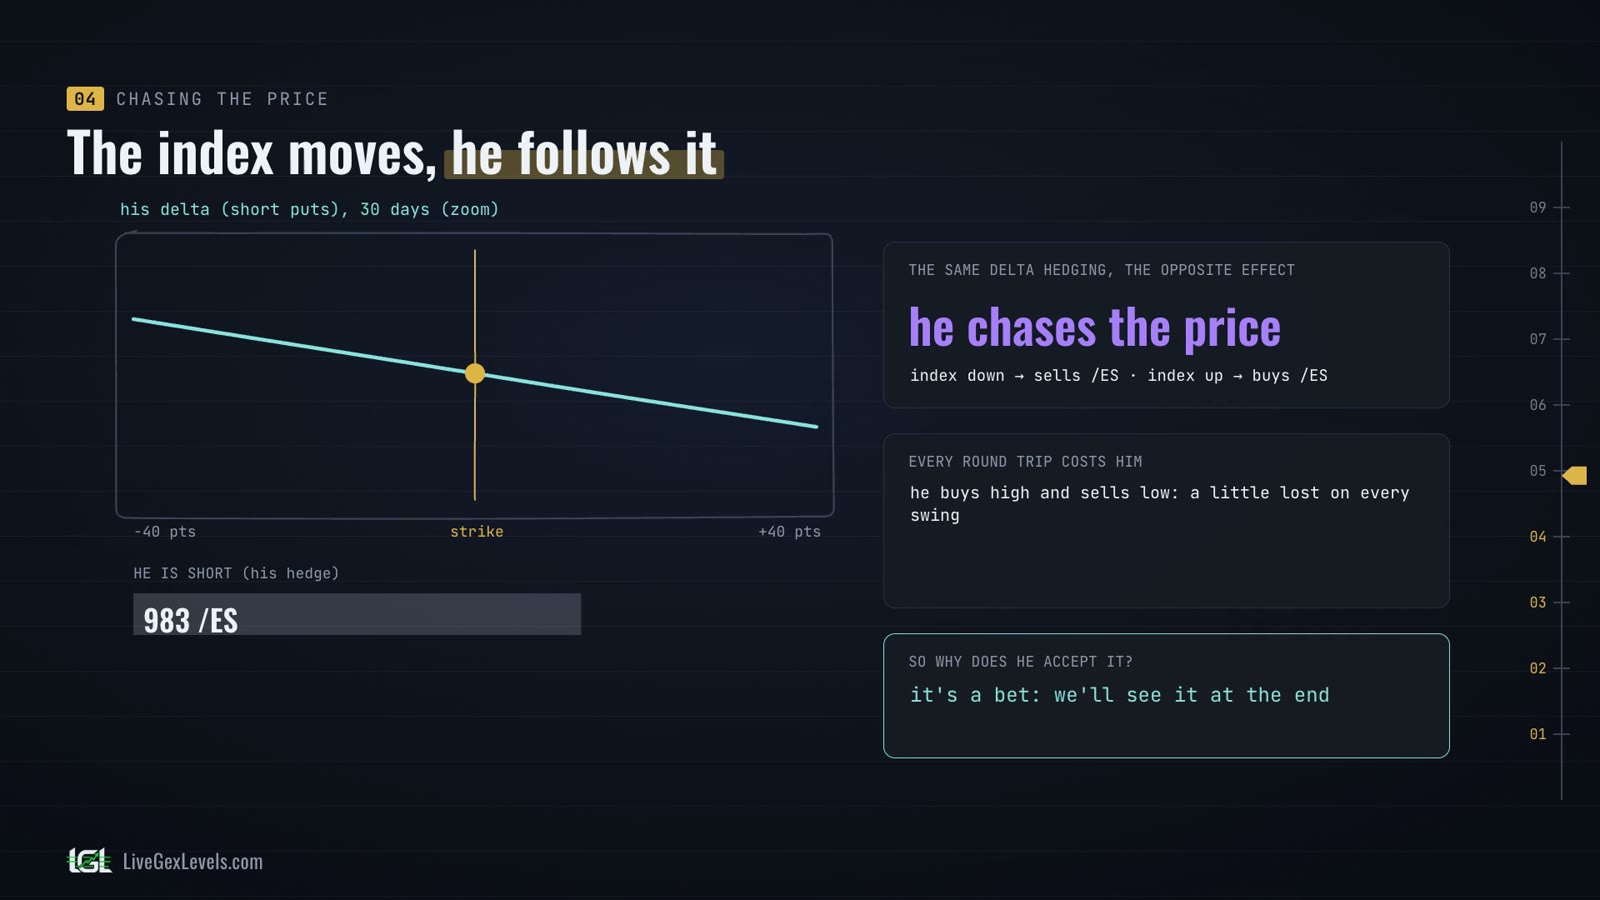
In motion: the index slips ten points, and he sells about 24 ES. Another ten down, and he sells again. It bounces, and he buys back. It climbs above the strike, and he buys more. When it comes back down, he sells. Every time, with the move.
It's the same delta hedging as last time, with the opposite effect. Then, the market maker traded against the move and braked it. Now he chases it: he sells when the price falls and buys when it rises.
And every round trip costs him a little, because he buys high and sells low. So why does he accept it? It's a bet: we'll see it at the end.
Near expiry
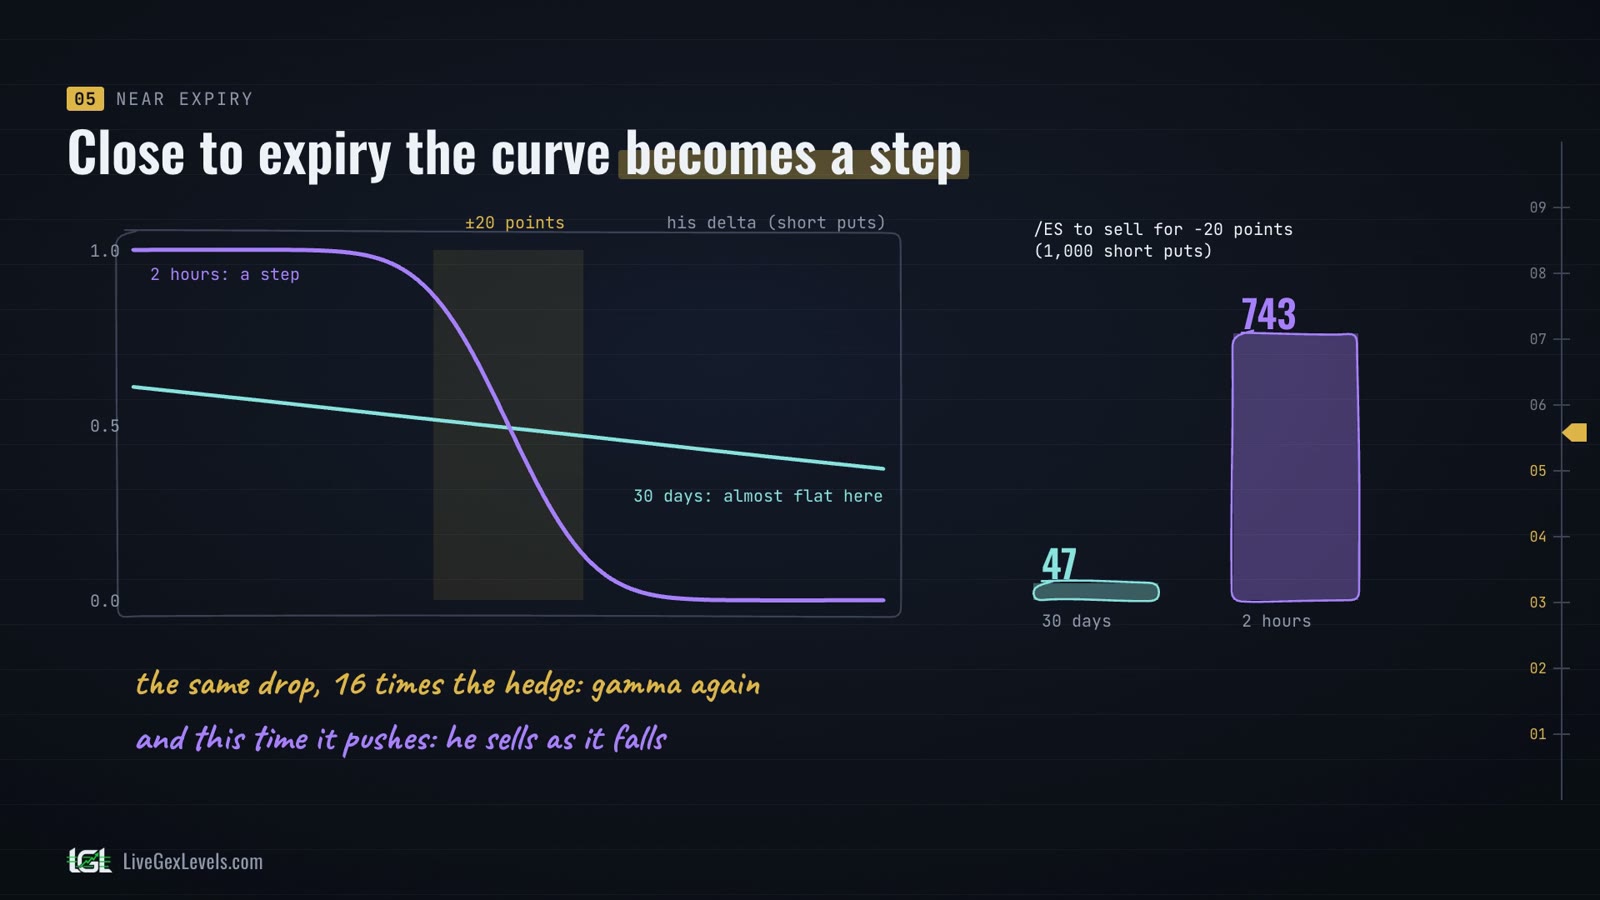
Now bring it close to expiry, with the same put and the same strike. Thirty days out, the curve of his delta is soft, spread over hundreds of points. Two hours before expiry it becomes a step: from almost zero above the strike to almost one below it, within a few dozen points.
In the model, for the same twenty-point drop, his 1,000 puts need 47 ES sold at thirty days, and 743 at two hours: about sixteen times as much. That's gamma again, and this time it pushes.
So, two hours from expiry, the same game moves hundreds of ES every five points, in the direction of the move. If the price falls toward a strike where market makers are short many puts, they have to sell more and more, right as it falls. That's why, with negative gamma, a level can become an accelerator instead of a brake.
Who buys
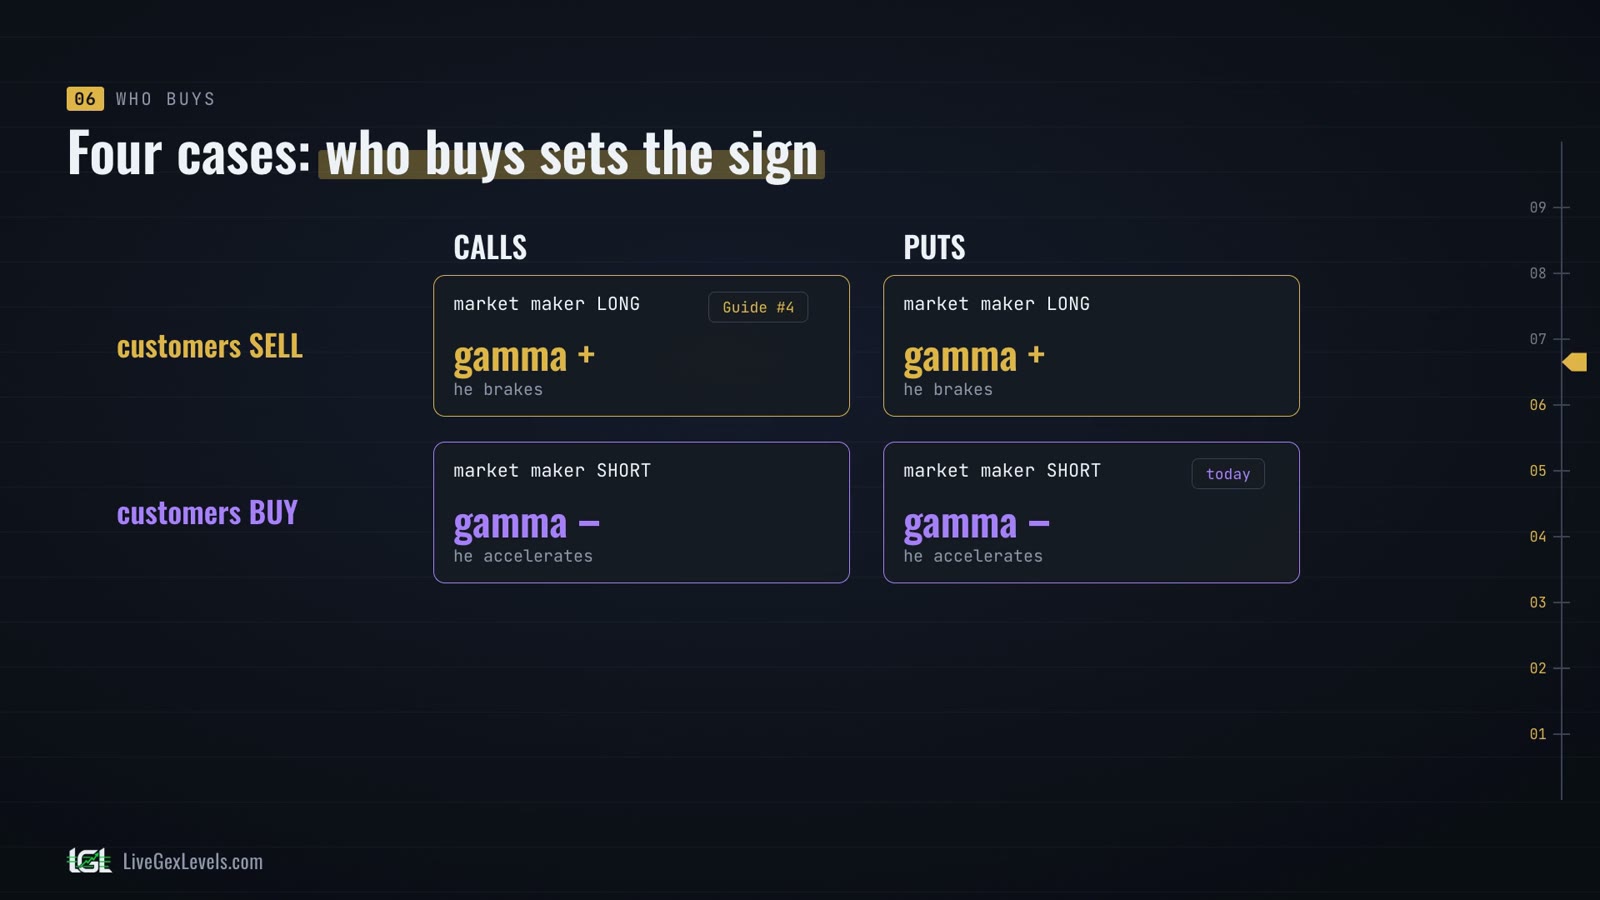
Now a simple rule, worth remembering. Four cases: customers buy or sell, calls or puts.
When customers sell options, calls or puts, the market maker is long: positive gamma, and he tends to brake. That was the previous episode. When customers buy options, calls or puts, he is short: negative gamma, and he tends to accelerate. That's today.
What sets the sign is who buys, not whether it's a call or a put.
Negative gamma
So, what does negative gamma mean? First: customers bought, so he is short the options. Short options have negative gamma, and the sign that matters is the market maker's.
Second: with negative gamma, his delta moves against the price. The index falls, his delta rises, and he sells ES. The index rises, his delta falls, and he buys.
Third: he trades with the move. He sells into the drops and buys into the rises, so the price gets pushed and the moves tend to get wider. In the first episode, Guide #1, we said that dealers sometimes brake the price and sometimes amplify it: this is the amplifier.
With negative gamma, moves tend to be wider, but gamma doesn't tell you which way.
The market maker's bet
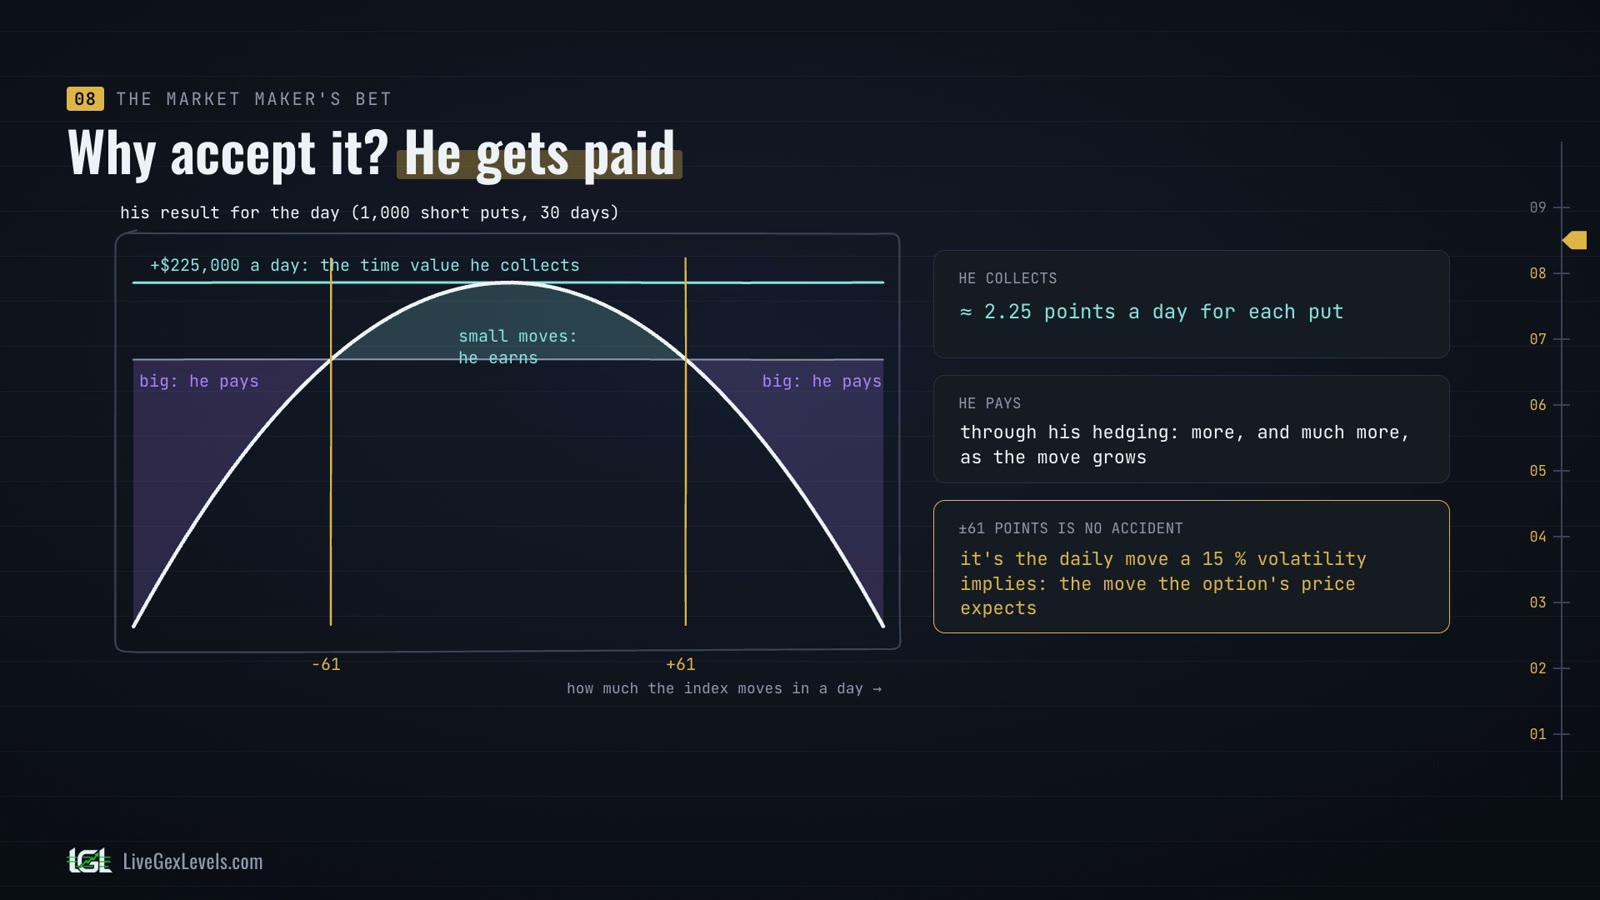
So why does the market maker accept a position that makes him chase the price? Because he gets paid for it. Each put he sold loses a little time value every day, and that value goes to him: in the model, about two and a quarter points a day at thirty days, which on 1,000 puts is about 225,000 dollars a day.
On the other side, every move costs him something through his hedging, and big moves cost much more than small ones. In the model, the line between the two is about 61 points a day: if the index moves less, the time value wins; if it moves more, the hedging costs more. And 61 points isn't random: on this illustrative index, it's the daily move that a 15% volatility implies. Selling the put is a bet that the market will move less than the option's price expects.
Why do customers pay for it? For the same reason people insure a house: the protection is worth more to them than what it costs on average. Protection has a price: options usually price in more movement than actually follows, so over time buyers pay that difference, and the seller collects it. Researchers call it the variance risk premium, and on the S&P 500 our own studies found it too.
But the bill doesn't arrive a little at a time. It arrives all at once, on the big days, when the price runs and the market maker has to sell as it falls. That's when negative gamma pushes the hardest.
«Our studies» are LiveGexLevels tests on past S&P 500 data: past results are not an indication of future results.
In brief
- Customers buy the put; the market maker sells it, and is short.
- He hedges by selling ES, about one for each at-the-money SPX option, then keeps adjusting with the move: he sells when the index falls and buys when it rises.
- Near expiry, those adjustments become large flows.
- Short options mean negative gamma: the moves tend to widen, but gamma doesn't say which way.
- He accepts it for the time value: a bet that the market moves less than the options expect.
Sources
- Gârleanu, Pedersen & Poteshman (2009): Demand-Based Option Pricing, Review of Financial Studies
- Carr & Wu (2009): Variance Risk Premiums, Review of Financial Studies
- Baltussen, Da, Lammers & Martens (2021): Hedging demand and market intraday momentum, Journal of Financial Economics
- Cboe: SPX options specifications
- CME Group: E-mini S&P 500 futures contract specs
More from this series
Read next
See the levels live
Seeing where dealers have to hedge is information a chart alone doesn't give you. Your edge starts with preparation.
Card required; after the trial the subscription renews at the launch price. For educational purposes only, not financial advice.