Options School · Published
The greeks on a chart: delta, gamma, theta and vega as curves
Your position's delta is 0.54. It all looks clear. In reality, that number alone tells you almost nothing, because the greeks are curves. On a risk graph we turn them on one at a time, then move the price, time and volatility. At the end, the short put, and a volatility that follows the index.
 Watch the video · 8:09
How to read the chart
In the last episode each greek was a number. Here we watch them move on a risk graph, one curve at a time. We'll move the price, then time, then volatility. Then we'll look at the short put, and at a simulation of volatility that follows the market.
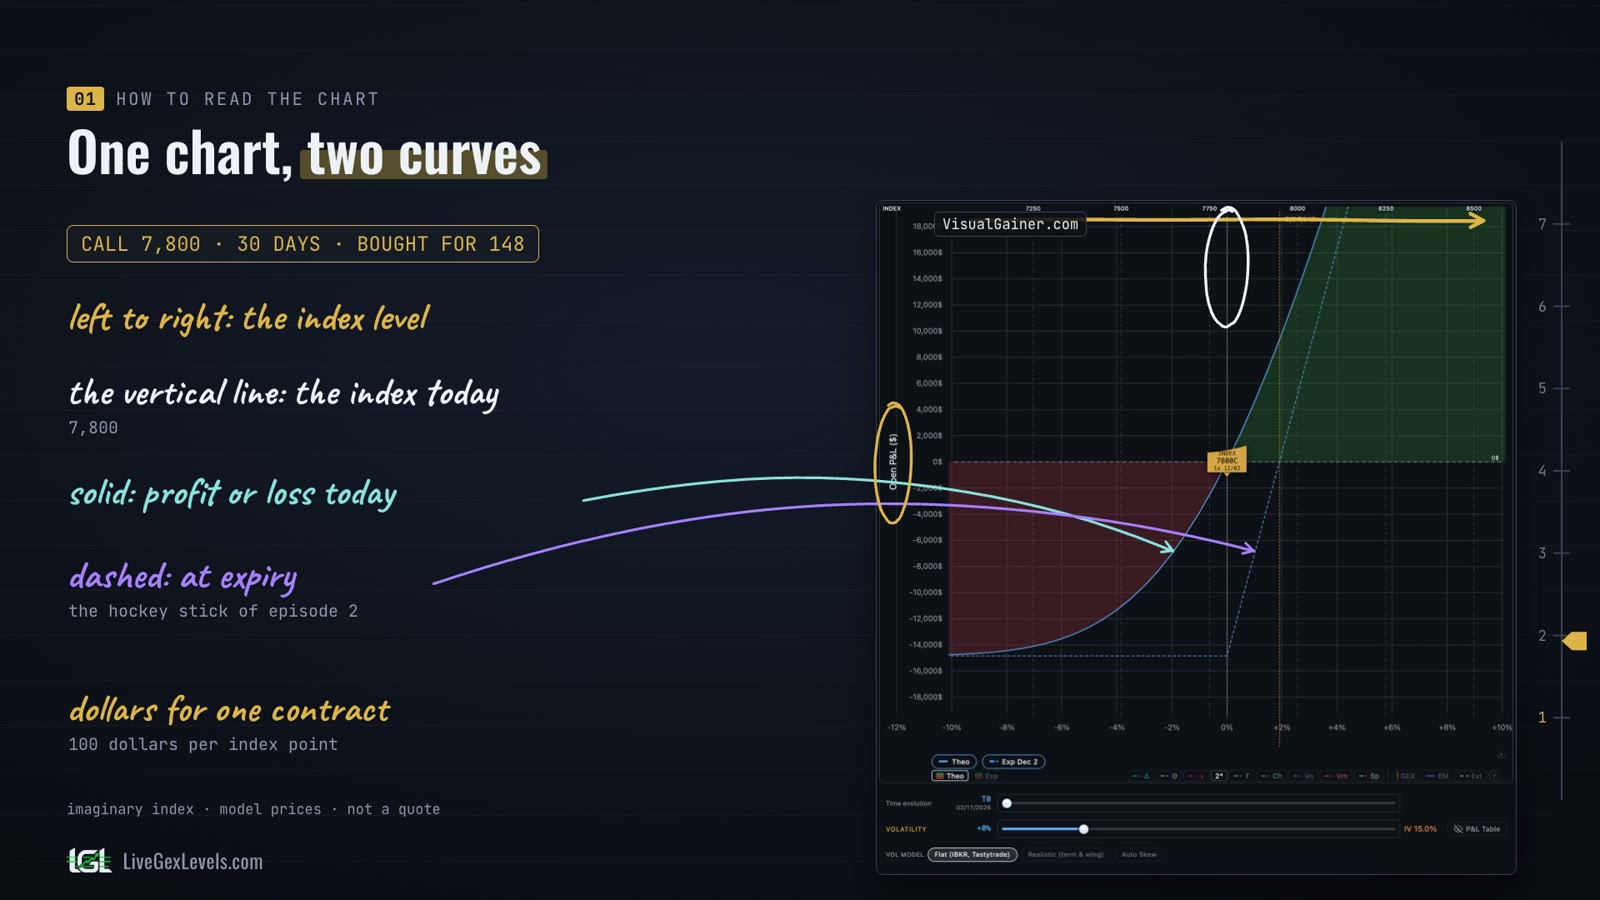
Here is our call, the 7,800 strike with thirty days to go, bought for 148 points.
From left to right runs the level of the index, and the vertical line marks the index today, at 7,800.
The solid line is the profit or loss today. The dashed line is the profit or loss at expiry, the hockey stick of the second episode.
The chart counts in dollars for one contract, a hundred dollars for each point of the index.
Every number in this article comes from a model on round numbers, not from market quotes. The index is at 7,800, implied volatility is at 15 percent, there are no dividends, and costs and spreads are left aside.
Delta: an S
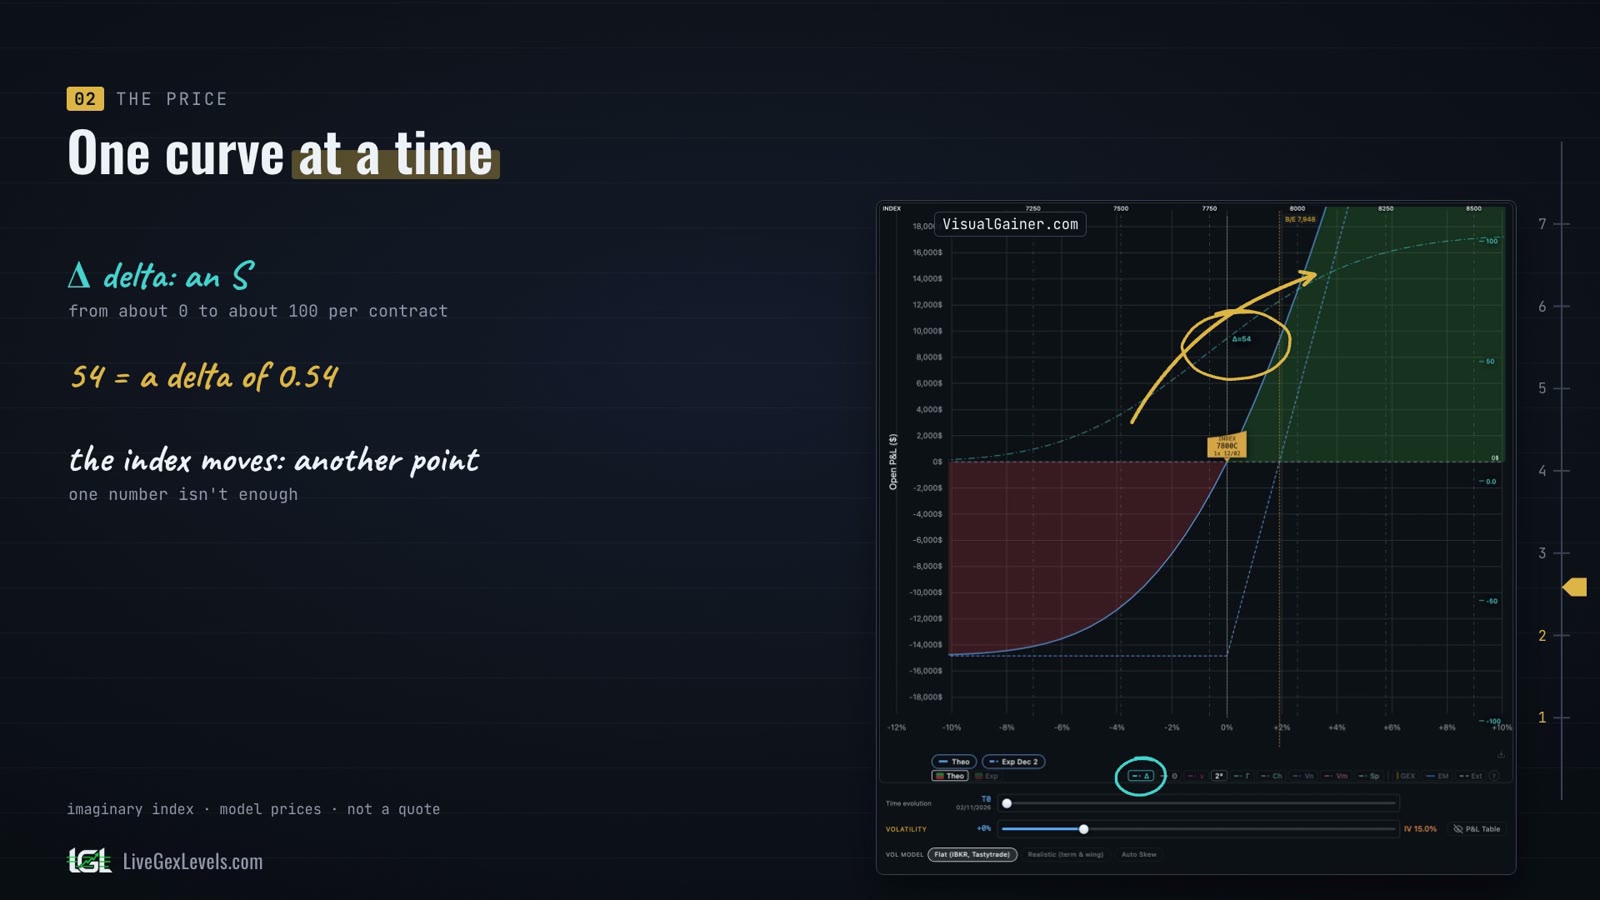
Now let's turn on the greeks, one at a time. First delta.
Delta is an S. Far below the strike it's near zero. Far above it's near a hundred, which on this chart, for one contract, is a delta of one.
Where the S meets the vertical line it reads 54, our delta of 0.54.
If the index moves, we read the same curve at another point. That's why one number isn't enough.
Gamma, theta and vega: a bell, a hole and a wider bell
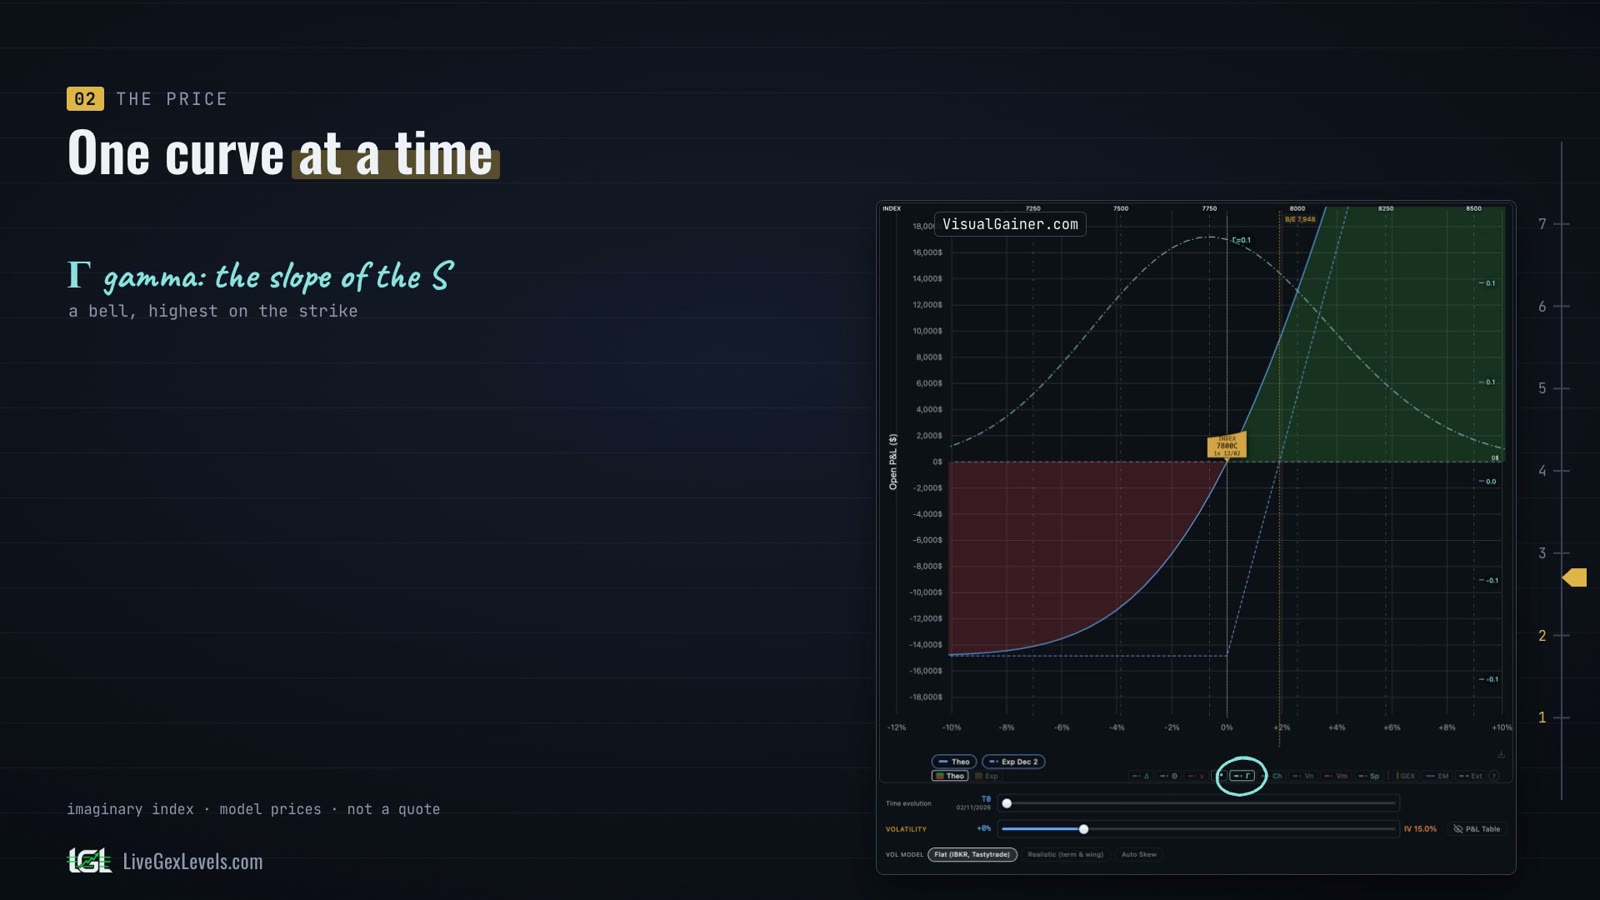
Gamma is the slope of that S. It's a bell, highest right on the strike.
Theta is a hole. The rent of the option is highest at the strike.
Vega is a wider bell. Volatility counts most where the option is at the money, with the strike close to the index.
Time, with the slider
Now we move time. Below the chart there's a slider, and we take it from today to the last day.
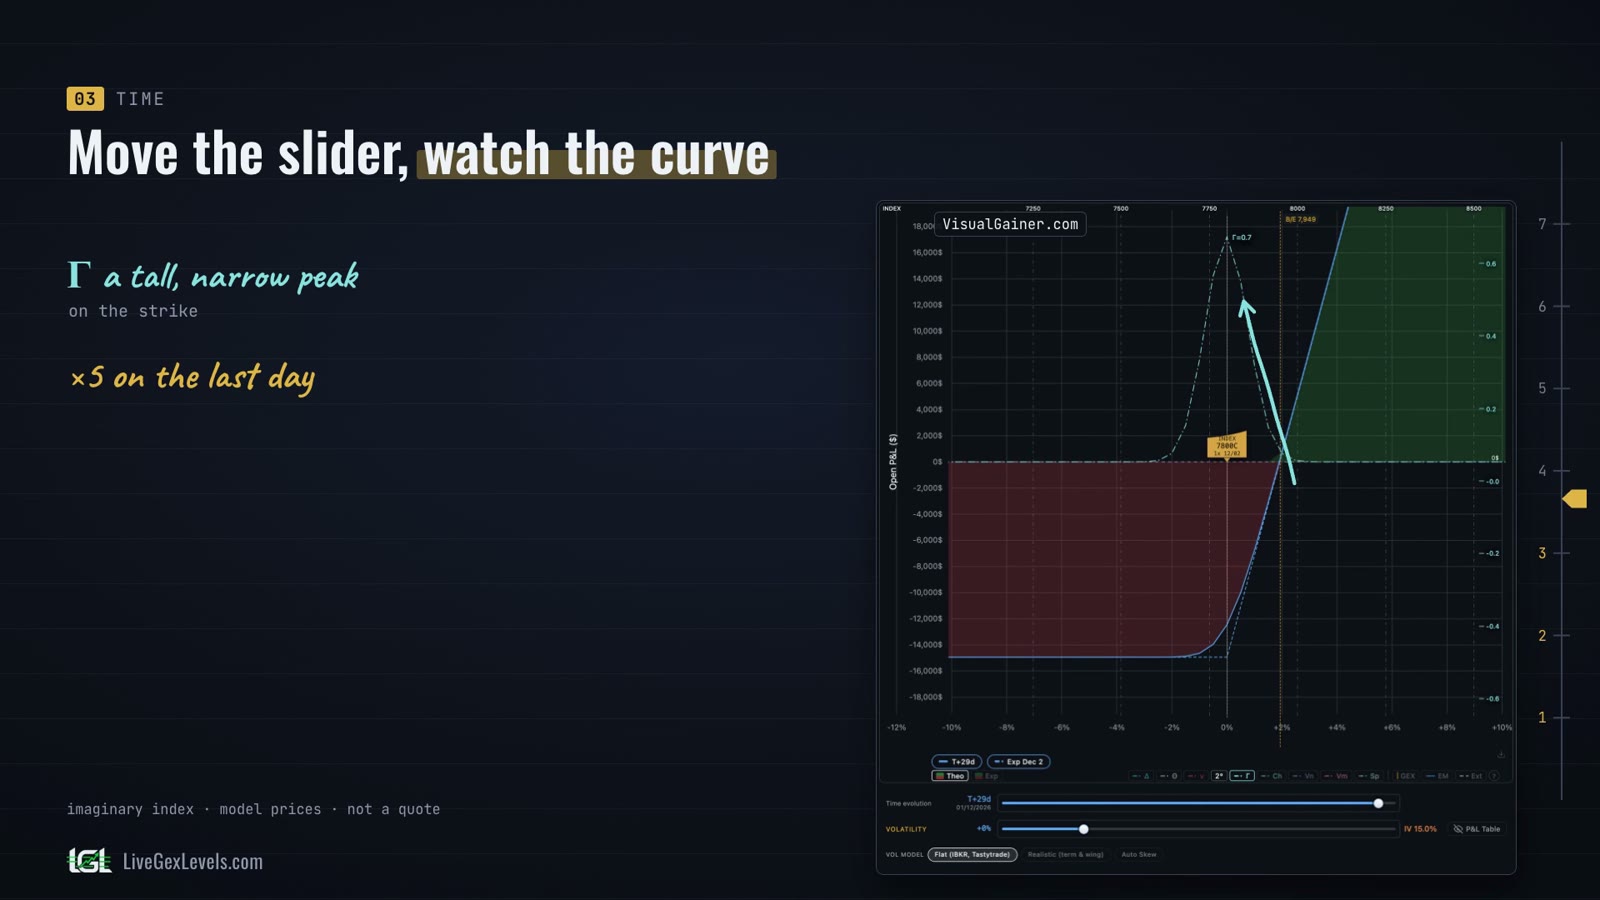
Watch the solid line. Day after day it sinks toward the hockey stick. With the index still, the call loses value, and that loss is theta.
Delta changes shape. The S gets steeper and steeper, and on the last day it's almost a step.
Gamma becomes a tall, narrow peak on the strike. On the last day it's five times higher than a month before.
Theta digs a deep hole. The rent goes from 2.7 points a day to almost 13.
Vega sinks. With little time left, fear has little room to count.
Volatility, the second slider
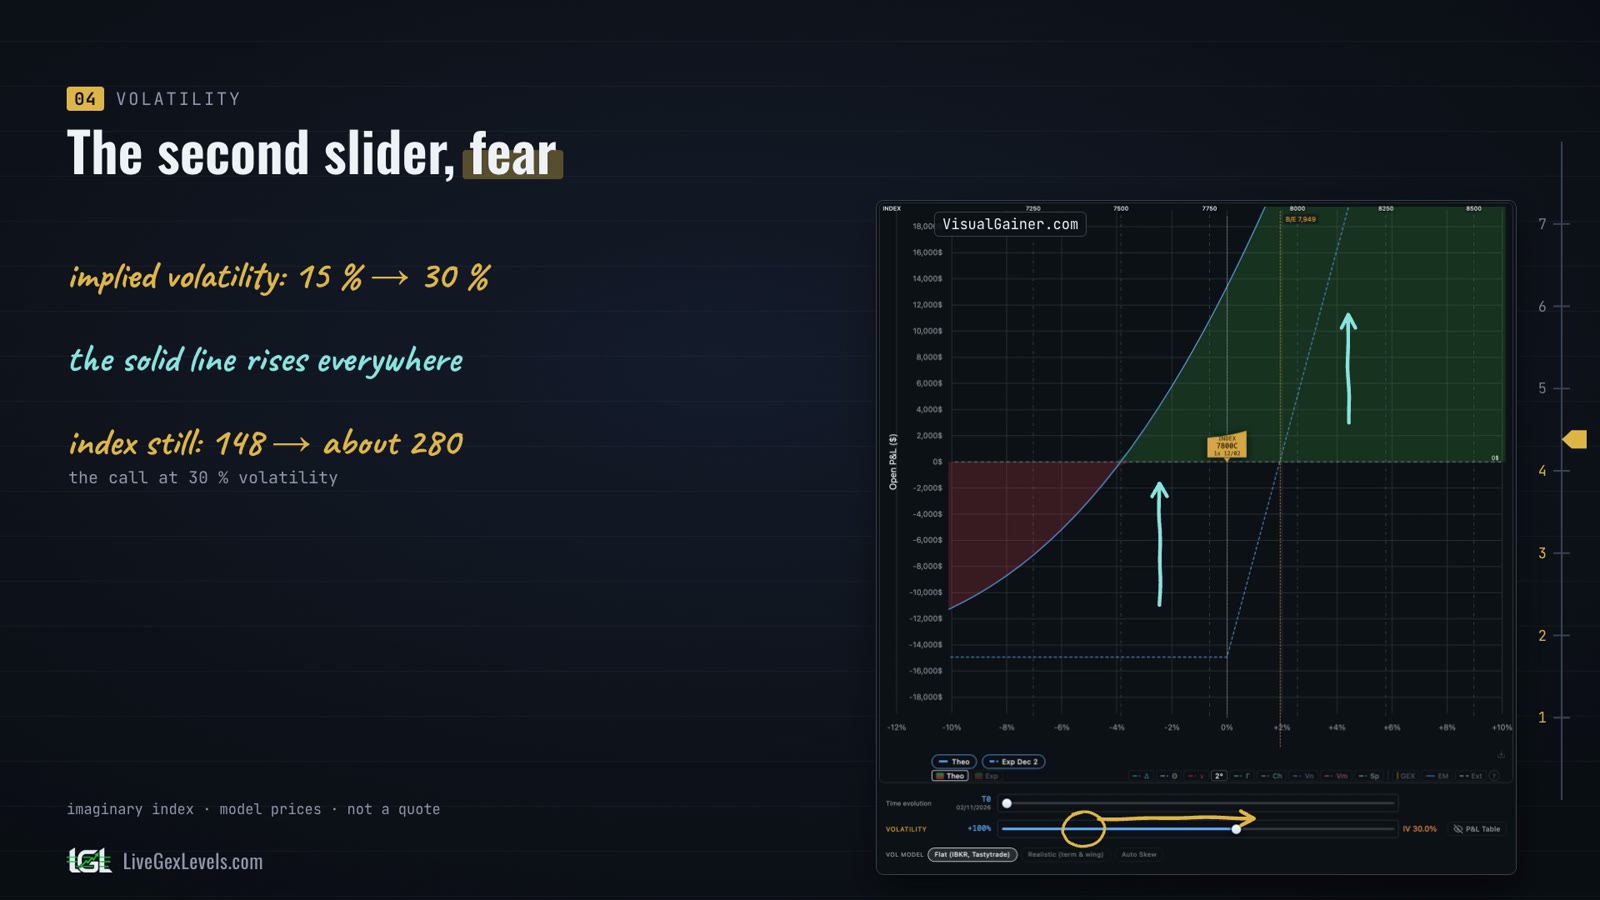
The second slider is volatility. We take implied volatility from 15 percent to 30, and beyond.
Watch the solid line. It rises everywhere. With the index still, at 30 percent the call is worth about 280 points instead of 148.
Delta flattens. With more volatility, even a call far from the strike can get there.
Gamma's bell gets lower and wider. At 30 percent its peak is half as high.
Theta's hole gets deeper. More volatility means a higher rent.
And if volatility falls, everything goes the other way. The call loses value even with the index still.
The short put
Now let's sell. Same page, a different position. We sell the put with the 7,800 strike and collect 120 points.
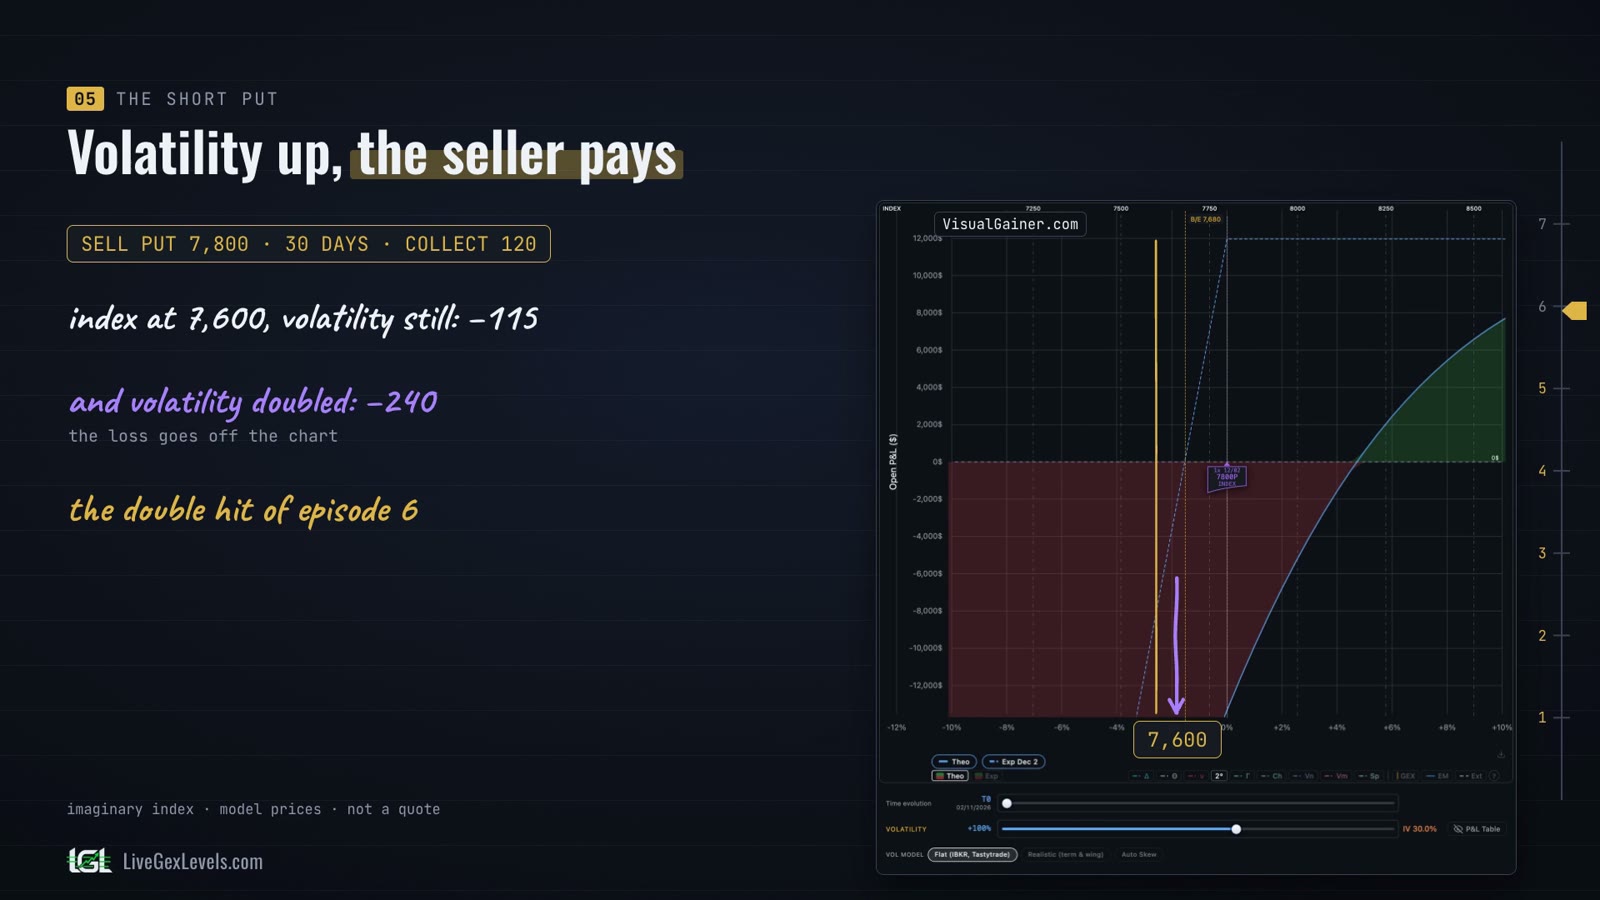
For whoever sells, vega is negative. Let's raise volatility again, with the index still.
The solid line sinks. At 30 percent the put is worth about 250 points. Whoever sold it at 120 is losing about 130, and the index hasn't moved.
Now add the price. If the index falls to 7,600 with volatility unchanged, the loss is about 115 points. If volatility doubles at the same time, the loss is about 240.
That's the double hit we saw in the sixth episode.
A more realistic volatility
So far the slider moved every volatility by the same amount, wherever the index was. Many platforms do the same.
But on the index, volatility usually rises when the price falls, and eases when the price rises. It's called skew.
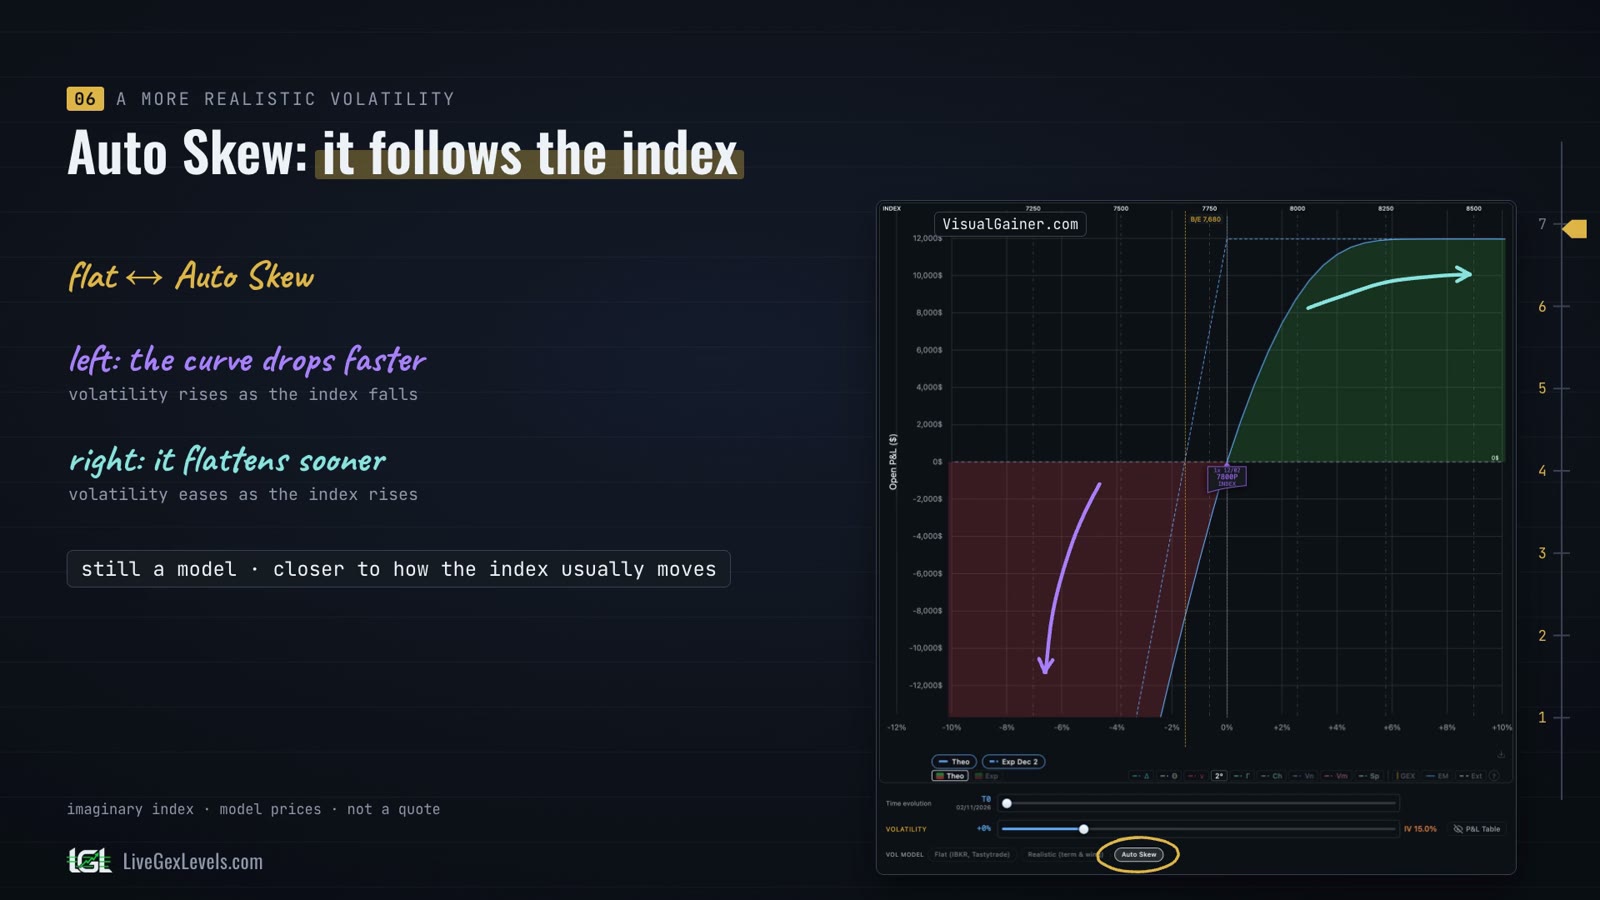
The risk graph in the video can simulate this too, with a mode called Auto Skew. Here is the short put again, first with flat volatility, then with Auto Skew.
On the left, where the index falls, the curve drops faster, because volatility rises. On the right it flattens sooner, because volatility eases.
It's still a model. But it gives a view of the curve closer to how the index usually moves.
Your broker usually shows you only one point of each curve, today's number. The whole curve lets you understand better how the position behaves as a whole.
In brief
- Each greek is a curve.
- The price moves you along the curves.
- Time turns delta into a step and gamma into a peak.
- Volatility that rises helps the option you bought and hurts the one you sold.
- Your broker usually shows you only one point of each curve, today's number.
- The whole curve shows how the position behaves as a whole, and a risk graph can also simulate a volatility that follows the index.
- All the numbers come from a model, costs excluded.
Sources
More from this series
Read next
See the levels live
Seeing where dealers have to hedge is information a chart alone doesn't give you. Your edge starts with preparation.
Card required; after the trial the subscription renews at the launch price. For educational purposes only, not financial advice.